Estimated Value: $503,000 - $932,000
5
Beds
3
Baths
2,476
Sq Ft
$254/Sq Ft
Est. Value
About This Home
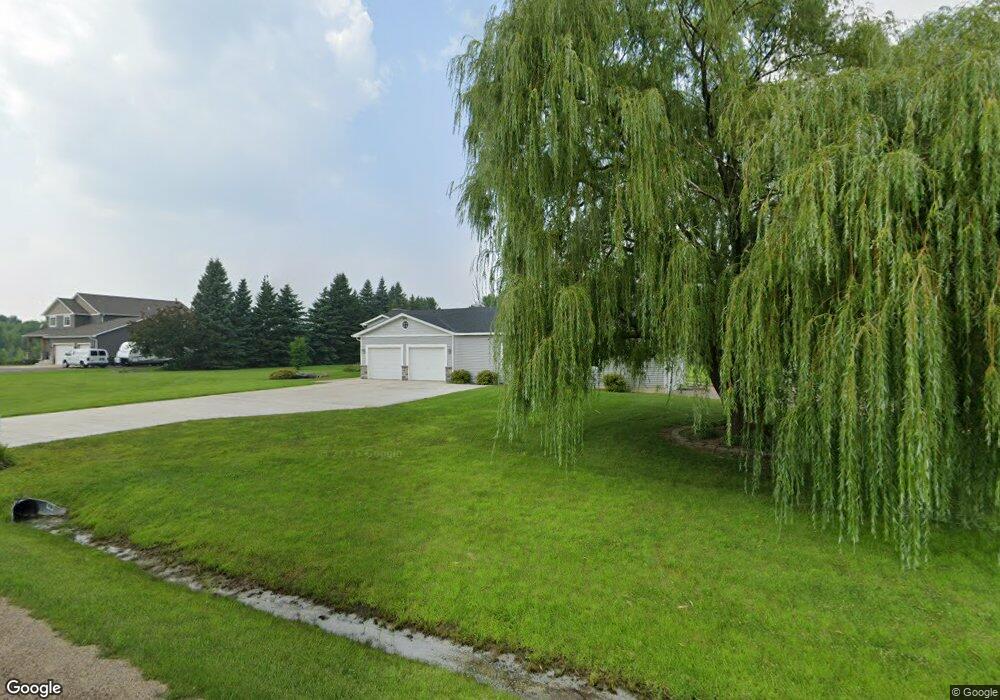
This home is located at 21636 Nystrom Ln, Hamel, MN 55340 and is currently estimated at $629,398, approximately $254 per square foot. 21636 Nystrom Ln is a home located in Hennepin County with nearby schools including Rockford Elementary Arts Magnet School, Rockford Middle School - Center for Environmental Studies, and Rockford High School.
Ownership History
Date
Name
Owned For
Owner Type
Purchase Details
Closed on
Jul 22, 2022
Sold by
Cummings Jr Kimball C and Cummings Jeanine E
Bought by
Cummings Revocable Intervivos Trust
Current Estimated Value
Purchase Details
Closed on
Sep 21, 2020
Sold by
Cummings Kimball C and Cummings Jeanine E
Bought by
Cummings Kimball C and Cummings Jeanine E
Home Financials for this Owner
Home Financials are based on the most recent Mortgage that was taken out on this home.
Original Mortgage
$150,000
Interest Rate
2.9%
Mortgage Type
New Conventional
Purchase Details
Closed on
Jan 19, 2017
Sold by
Cummings Cummings and Cummings Jeanine E
Bought by
Cummings Kimball C and Cummings Revocable Trust
Purchase Details
Closed on
Aug 29, 2007
Sold by
Lindsley Scott A
Bought by
Cummings Kimball C and Cummings Jeanine E
Create a Home Valuation Report for This Property
The Home Valuation Report is an in-depth analysis detailing your home's value as well as a comparison with similar homes in the area
Home Values in the Area
Average Home Value in this Area
Purchase History
| Date | Buyer | Sale Price | Title Company |
|---|---|---|---|
| Cummings Revocable Intervivos Trust | $3,000 | -- | |
| Cummings Kimball C | -- | Cities Title Services Llc | |
| Cummings Kimball C | -- | None Available | |
| Cummings Kimball C | $310,000 | -- |
Source: Public Records
Mortgage History
| Date | Status | Borrower | Loan Amount |
|---|---|---|---|
| Previous Owner | Cummings Kimball C | $150,000 |
Source: Public Records
Tax History
| Year | Tax Paid | Tax Assessment Tax Assessment Total Assessment is a certain percentage of the fair market value that is determined by local assessors to be the total taxable value of land and additions on the property. | Land | Improvement |
|---|---|---|---|---|
| 2024 | $5,764 | $460,500 | $115,000 | $345,500 |
| 2023 | $5,860 | $465,900 | $115,000 | $350,900 |
| 2022 | $5,313 | $441,000 | $115,000 | $326,000 |
| 2021 | $5,267 | $373,000 | $105,000 | $268,000 |
| 2020 | $5,100 | $364,000 | $105,000 | $259,000 |
| 2019 | $5,043 | $334,000 | $90,000 | $244,000 |
| 2018 | $4,695 | $321,000 | $90,000 | $231,000 |
| 2017 | $4,089 | $273,000 | $67,000 | $206,000 |
| 2016 | $3,923 | $259,000 | $71,000 | $188,000 |
| 2015 | $3,883 | $254,000 | $66,000 | $188,000 |
| 2014 | -- | $225,000 | $55,000 | $170,000 |
Source: Public Records
Map
Nearby Homes
- 4302 Hillside Dr
- 1405 Hamel Rd
- 21250 Horseshoe Trail
- 6233 Willow Dr
- 22320 Highway 55
- 2041# Larkin Rd
- 20417 Larkin Rd
- 20410 Larkin Rd
- 4596 Tovero Trail
- 4205 Willow Dr
- 7815 Corcoran Trail W
- 4594 Tovero Trail
- 4592 Tovero Trail
- 4425 Brindle Dr
- 4505 Tovero Trail
- 4508 Tovero Trail
- 4513 Tovero Trail
- 6857 Zenwood Ln
- 6855 Zenwood Ln
- 4576 Tovero Trail
- 21636 Nystrom Ln
- 21617 21617 Nystrom-Lane-
- 21646 Nystrom Ln
- 21600 Nystrom Ln
- 21617 Nystrom Ln
- 21617 Nystrom Ln
- 21635 Homestead Trail
- 21645 Homestead Trail
- 21625 Homestead Trail
- 21607 Nystrom Ln
- 21645 Homestead Trail
- 21627 Nystrom Ln
- 21539 Homestead Trail
- 21539 Homestead Trail
- 21645 21645 Homestead-Trail-
- 21535 Nystrom Ln
- 21777 Homestead Trail
- 21528 Nystrom Ln
- 21630 Homestead Trail
- 21527 Homestead Trail
Your Personal Tour Guide
Ask me questions while you tour the home.