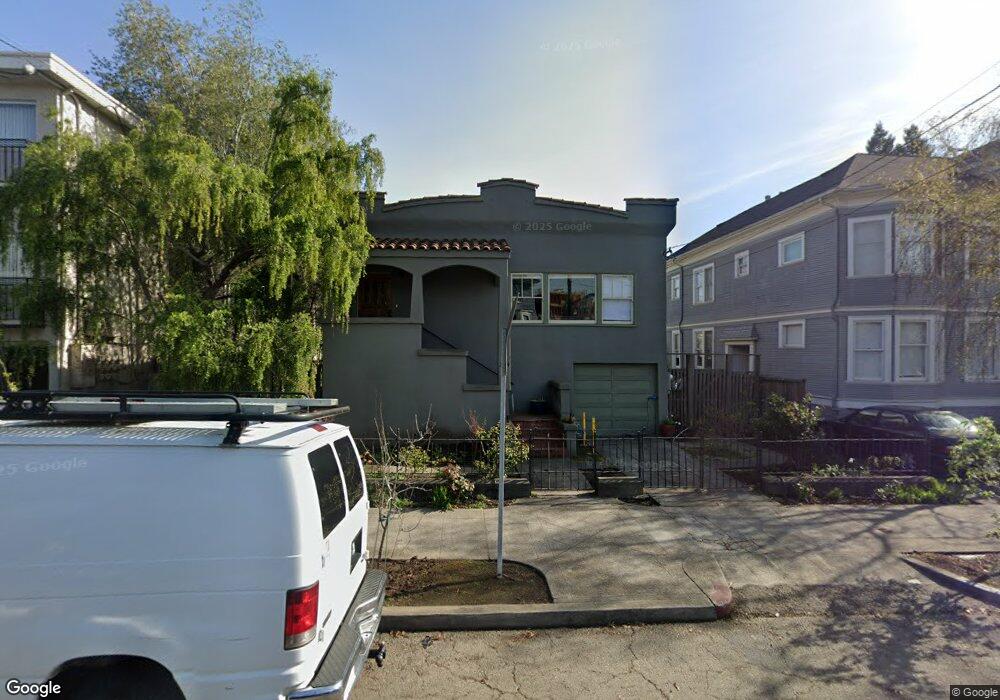
2164 Blake St Berkeley, CA 94704
South Berkeley NeighborhoodEstimated Value: $1,458,000 - $1,993,000
3
Beds
2
Baths
1,551
Sq Ft
$1,162/Sq Ft
Est. Value
About This Home
This home is located at 2164 Blake St, Berkeley, CA 94704 and is currently estimated at $1,801,831, approximately $1,161 per square foot. 2164 Blake St is a home located in Alameda County with nearby schools including Malcolm X Elementary School, Emerson Elementary School, and John Muir Elementary School.
Ownership History
Date
Name
Owned For
Owner Type
Purchase Details
Closed on
Aug 14, 2012
Sold by
Feldman Benjamin J and Lewis Jenna A
Bought by
Feldman Benjamin J and Lewis Jenna A
Current Estimated Value
Home Financials for this Owner
Home Financials are based on the most recent Mortgage that was taken out on this home.
Original Mortgage
$525,000
Outstanding Balance
$360,258
Interest Rate
3.47%
Mortgage Type
New Conventional
Estimated Equity
$1,441,573
Purchase Details
Closed on
Jul 13, 2011
Sold by
Hilliard Lark and Hilliard Michael R
Bought by
Feldman Benjamin J and Lewis Jenna A
Home Financials for this Owner
Home Financials are based on the most recent Mortgage that was taken out on this home.
Original Mortgage
$533,600
Interest Rate
4.5%
Mortgage Type
New Conventional
Purchase Details
Closed on
Sep 7, 2007
Sold by
Hilliard Lark and Dorothy F Morris Trust
Bought by
Hilliard Lark and Hilliard Michael R
Purchase Details
Closed on
Oct 1, 2002
Sold by
Morris Dorothy F
Bought by
Morris Dorothy Frances and Hilliard Lark Renee
Create a Home Valuation Report for This Property
The Home Valuation Report is an in-depth analysis detailing your home's value as well as a comparison with similar homes in the area
Home Values in the Area
Average Home Value in this Area
Purchase History
| Date | Buyer | Sale Price | Title Company |
|---|---|---|---|
| Feldman Benjamin J | -- | Old Republic Title Company | |
| Feldman Benjamin J | $667,000 | Old Republic Title Company | |
| Feldman Benjamin J | -- | Old Republic Title Company B | |
| Hilliard Lark | -- | None Available | |
| Morris Dorothy Frances | -- | -- |
Source: Public Records
Mortgage History
| Date | Status | Borrower | Loan Amount |
|---|---|---|---|
| Open | Feldman Benjamin J | $525,000 | |
| Closed | Feldman Benjamin J | $533,600 |
Source: Public Records
Tax History
| Year | Tax Paid | Tax Assessment Tax Assessment Total Assessment is a certain percentage of the fair market value that is determined by local assessors to be the total taxable value of land and additions on the property. | Land | Improvement |
|---|---|---|---|---|
| 2025 | $15,696 | $899,196 | $251,323 | $654,873 |
| 2024 | $15,696 | $881,433 | $246,397 | $642,036 |
| 2023 | $15,297 | $871,015 | $241,566 | $629,449 |
| 2022 | $14,928 | $846,938 | $236,830 | $617,108 |
| 2021 | $14,943 | $830,199 | $232,188 | $605,011 |
| 2020 | $14,086 | $828,620 | $229,808 | $598,812 |
| 2019 | $13,464 | $812,379 | $225,304 | $587,075 |
| 2018 | $13,207 | $796,456 | $220,888 | $575,568 |
| 2017 | $12,741 | $780,843 | $216,558 | $564,285 |
| 2016 | $12,283 | $765,533 | $212,312 | $553,221 |
| 2015 | $12,096 | $754,039 | $209,124 | $544,915 |
| 2014 | $11,929 | $739,270 | $205,028 | $534,242 |
Source: Public Records
Map
Nearby Homes
- 2018 Blake St
- 2550 Dana St Unit 2F
- 2319 Ward St
- 1901 Parker St Unit 3
- 2702 Dana St
- 2535 Chilton Way
- 2509 Dwight Way
- 2701 Grant St
- 2923 Wheeler St
- 2243 Ashby Ave
- 2110 Ashby Ave
- 2917 Telegraph Ave
- 2057 Emerson St
- 1645 Dwight Way
- 2727 McGee Ave
- 2935 Florence St
- 3046 Deakin St
- 2218 -2222 Grant St
- 1612 Parker St
- 1612 Carleton St
- 2172 Blake St
- 2158 Blake St
- 2198 Blake St
- 2126 Blake St Unit B
- 2126 Blake St Unit A
- 2126 Blake St
- 2538 Fulton St
- 2133 Parker St Unit 2
- 2133 Parker St
- 2137 Parker St
- 2129 Parker St
- 2542 Fulton St
- 2125 Parker St
- 2143 Blake St
- 2137 Blake St
- 2147 Blake St
- 2123 Parker St
- 2147 Parker St
- 2149 Blake St Unit 410
- 2121 Parker St
Your Personal Tour Guide
Ask me questions while you tour the home.