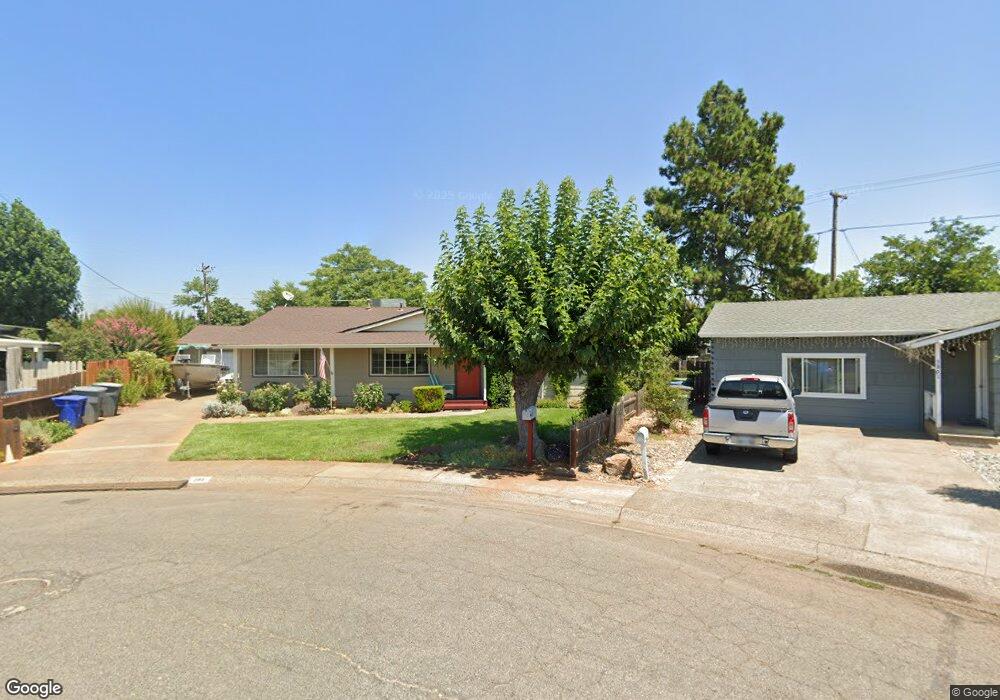
2164 Comet St Redding, CA 96002
Starview NeighborhoodEstimated Value: $313,481 - $337,000
3
Beds
2
Baths
1,248
Sq Ft
$259/Sq Ft
Est. Value
About This Home
This home is located at 2164 Comet St, Redding, CA 96002 and is currently estimated at $323,370, approximately $259 per square foot. 2164 Comet St is a home located in Shasta County with nearby schools including Alta Mesa Elementary School, Parsons Junior High School, and Enterprise High School.
Ownership History
Date
Name
Owned For
Owner Type
Purchase Details
Closed on
Aug 9, 2023
Sold by
Coholan Richard D
Bought by
Richard D Coholan Revocable Living Trust and Coholan
Current Estimated Value
Purchase Details
Closed on
Aug 10, 2005
Sold by
Clendenon Harley and Clendenon Jeanette
Bought by
Coholan Richard D
Home Financials for this Owner
Home Financials are based on the most recent Mortgage that was taken out on this home.
Original Mortgage
$192,000
Interest Rate
5.48%
Mortgage Type
Fannie Mae Freddie Mac
Purchase Details
Closed on
Mar 15, 2005
Sold by
Richter John Joseph
Bought by
Clendenon Harley and Clendenon Jeanette
Home Financials for this Owner
Home Financials are based on the most recent Mortgage that was taken out on this home.
Original Mortgage
$170,100
Interest Rate
2.37%
Mortgage Type
Unknown
Purchase Details
Closed on
Oct 19, 1998
Sold by
Woodruff Carol A
Bought by
Richter Carol A
Create a Home Valuation Report for This Property
The Home Valuation Report is an in-depth analysis detailing your home's value as well as a comparison with similar homes in the area
Home Values in the Area
Average Home Value in this Area
Purchase History
| Date | Buyer | Sale Price | Title Company |
|---|---|---|---|
| Richard D Coholan Revocable Living Trust | -- | None Listed On Document | |
| Coholan Richard D | $275,000 | Chicago Title Co | |
| Clendenon Harley | $189,000 | Fidelity Natl Title Co Of Ca | |
| Richter Carol A | -- | -- |
Source: Public Records
Mortgage History
| Date | Status | Borrower | Loan Amount |
|---|---|---|---|
| Previous Owner | Coholan Richard D | $192,000 | |
| Previous Owner | Clendenon Harley | $170,100 |
Source: Public Records
Tax History
| Year | Tax Paid | Tax Assessment Tax Assessment Total Assessment is a certain percentage of the fair market value that is determined by local assessors to be the total taxable value of land and additions on the property. | Land | Improvement |
|---|---|---|---|---|
| 2025 | $3,487 | $325,000 | $50,000 | $275,000 |
| 2024 | $3,342 | $315,000 | $50,000 | $265,000 |
| 2023 | $3,342 | $300,000 | $50,000 | $250,000 |
| 2022 | $3,039 | $275,000 | $50,000 | $225,000 |
| 2021 | $2,510 | $230,000 | $45,000 | $185,000 |
| 2020 | $2,254 | $205,000 | $40,000 | $165,000 |
| 2019 | $2,116 | $190,000 | $40,000 | $150,000 |
| 2018 | $2,039 | $181,500 | $49,500 | $132,000 |
| 2017 | $2,115 | $181,500 | $49,500 | $132,000 |
| 2016 | $1,837 | $165,000 | $45,000 | $120,000 |
| 2015 | $1,740 | $155,000 | $35,000 | $120,000 |
| 2014 | $1,705 | $150,000 | $30,000 | $120,000 |
Source: Public Records
Map
Nearby Homes
- 2185 Galaxy Way
- 3732 Mercury Dr
- 2332 Venus Way
- 2068 Solar Way
- 3778 Scorpius Way
- 4001 Alta Mesa Dr
- 3985 Cirrus St
- 1827 Bembow Dr
- 3688 Polaris Way
- 3594 Laramie St
- 3466 Silverwood St
- 3425 Silverwood St
- 3341 Timbercreek Dr
- 3512 Capricorn Way
- 1785 Soda Springs Cir
- 1922 Eddy Way
- 0 Shasta View Unit 25-1945
- 1513 Harpole Rd
- 3072 Alta Mesa Dr
- 1959 Alexis Ct
- 3801 Meteor St
- 2152 Comet St
- 2171 Venus Way
- 3790 Alta Mesa Dr
- 3778 Alta Mesa Dr
- 2185 Venus Way
- 2159 Venus Way
- 3804 Alta Mesa Dr
- 3813 Meteor St
- 2140 Comet St
- 2197 Venus Way
- 2145 Venus Way
- 3812 Alta Mesa Dr
- 2145 Comet St
- 3825 Meteor St
- 2128 Comet St
- 2133 Venus Way
- 2129 Comet St
- 2172 Venus Way
- 3742 Apollo St
Your Personal Tour Guide
Ask me questions while you tour the home.