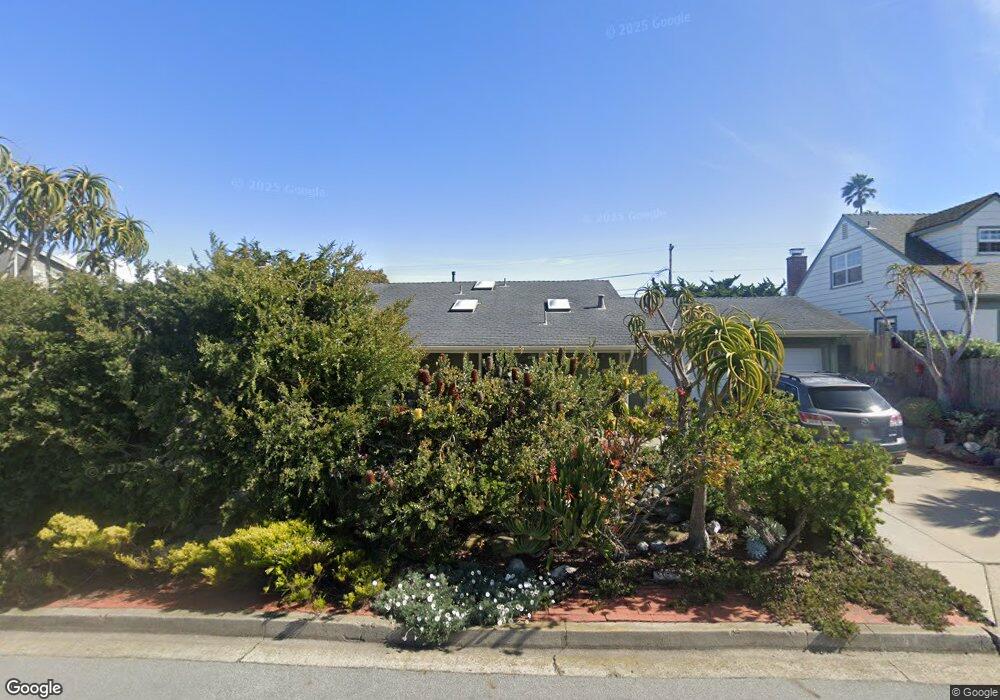
2164 Inyo St Los Osos, CA 93402
Estimated Value: $1,140,000 - $1,170,000
5
Beds
3
Baths
2,000
Sq Ft
$581/Sq Ft
Est. Value
About This Home
This home is located at 2164 Inyo St, Los Osos, CA 93402 and is currently estimated at $1,161,079, approximately $580 per square foot. 2164 Inyo St is a home located in San Luis Obispo County with nearby schools including Monarch Grove Elementary School, Los Osos Middle School, and Morro Bay High School.
Ownership History
Date
Name
Owned For
Owner Type
Purchase Details
Closed on
Mar 16, 2004
Sold by
Goetz John C and Goetz Devon P
Bought by
Goetz John C and Goetz Devon P
Current Estimated Value
Purchase Details
Closed on
Dec 3, 1997
Sold by
Dolge Randall and Dolge Barbara
Bought by
Goetz John and Goetz Devon Patton
Home Financials for this Owner
Home Financials are based on the most recent Mortgage that was taken out on this home.
Original Mortgage
$173,900
Outstanding Balance
$29,239
Interest Rate
7.16%
Mortgage Type
Seller Take Back
Estimated Equity
$1,131,840
Purchase Details
Closed on
Nov 26, 1997
Sold by
Schaffer Peter Paul and Schaffer Donna Gay
Bought by
Dolge Randall and Dolge Barbara
Home Financials for this Owner
Home Financials are based on the most recent Mortgage that was taken out on this home.
Original Mortgage
$173,900
Outstanding Balance
$29,239
Interest Rate
7.16%
Mortgage Type
Seller Take Back
Estimated Equity
$1,131,840
Create a Home Valuation Report for This Property
The Home Valuation Report is an in-depth analysis detailing your home's value as well as a comparison with similar homes in the area
Home Values in the Area
Average Home Value in this Area
Purchase History
| Date | Buyer | Sale Price | Title Company |
|---|---|---|---|
| Goetz John C | -- | -- | |
| Goetz John C | -- | -- | |
| Goetz John | $50,000 | First American Title Ins Co | |
| Dolge Randall | $207,500 | First American Title Ins Co |
Source: Public Records
Mortgage History
| Date | Status | Borrower | Loan Amount |
|---|---|---|---|
| Open | Dolge Randall | $173,900 |
Source: Public Records
Tax History Compared to Growth
Tax History
| Year | Tax Paid | Tax Assessment Tax Assessment Total Assessment is a certain percentage of the fair market value that is determined by local assessors to be the total taxable value of land and additions on the property. | Land | Improvement |
|---|---|---|---|---|
| 2025 | $6,437 | $372,325 | $143,694 | $228,631 |
| 2024 | $6,329 | $365,026 | $140,877 | $224,149 |
| 2023 | $6,329 | $357,869 | $138,115 | $219,754 |
| 2022 | $6,250 | $350,853 | $135,407 | $215,446 |
| 2021 | $6,178 | $343,974 | $132,752 | $211,222 |
| 2020 | $5,841 | $340,448 | $131,391 | $209,057 |
| 2019 | $5,663 | $333,773 | $128,815 | $204,958 |
| 2018 | $5,980 | $327,230 | $126,290 | $200,940 |
| 2017 | $5,592 | $320,814 | $123,814 | $197,000 |
| 2016 | $4,344 | $314,525 | $121,387 | $193,138 |
| 2015 | $4,293 | $309,801 | $119,564 | $190,237 |
| 2014 | $4,015 | $303,733 | $117,222 | $186,511 |
Source: Public Records
Map
Nearby Homes