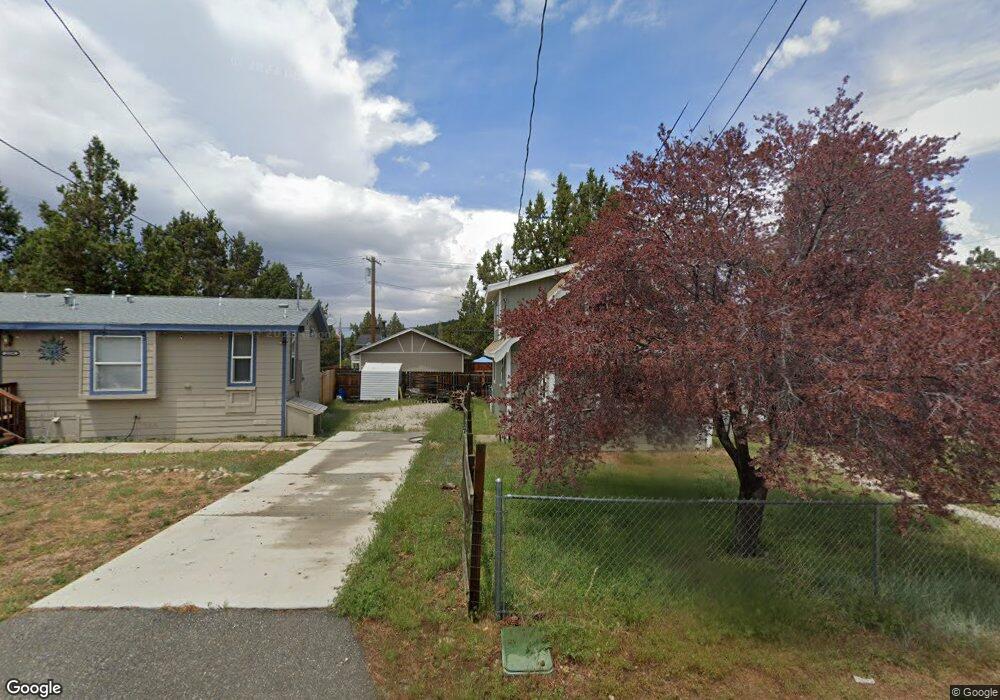
2165 2nd Ln Big Bear City, CA 92314
Estimated Value: $252,000 - $280,000
1
Bed
1
Bath
824
Sq Ft
$319/Sq Ft
Est. Value
About This Home
This home is located at 2165 2nd Ln, Big Bear City, CA 92314 and is currently estimated at $263,167, approximately $319 per square foot. 2165 2nd Ln is a home located in San Bernardino County with nearby schools including Baldwin Lane Elementary School, Big Bear Middle School, and Big Bear High School.
Ownership History
Date
Name
Owned For
Owner Type
Purchase Details
Closed on
May 14, 2006
Sold by
Warlick Mary J
Bought by
Cronin Maureen W
Current Estimated Value
Home Financials for this Owner
Home Financials are based on the most recent Mortgage that was taken out on this home.
Original Mortgage
$120,000
Interest Rate
6.63%
Mortgage Type
Purchase Money Mortgage
Purchase Details
Closed on
Jul 30, 2001
Sold by
Warlick Wesley V and Warlick Mary J
Bought by
Warlick Wesley V and Warlick Mary J
Purchase Details
Closed on
Feb 21, 1995
Sold by
Harbor Jack E and Harbor Eleanor B
Bought by
Warlick Wesley V and Warlick Mary J
Home Financials for this Owner
Home Financials are based on the most recent Mortgage that was taken out on this home.
Original Mortgage
$36,800
Interest Rate
8.9%
Create a Home Valuation Report for This Property
The Home Valuation Report is an in-depth analysis detailing your home's value as well as a comparison with similar homes in the area
Home Values in the Area
Average Home Value in this Area
Purchase History
We collect this data history from publicly available records. To have your information removed, we recommend requesting removal directly through your county’s website.
| Date | Buyer | Sale Price | Title Company |
|---|---|---|---|
| Cronin Maureen W | $150,000 | Ticor Title Co | |
| Warlick Wesley V | -- | -- | |
| Warlick Wesley V | $46,000 | Fidelity National Title Ins |
Source: Public Records
Mortgage History
We collect this data history from publicly available records. To have your information removed, we recommend requesting removal directly through your county’s website.
| Date | Status | Borrower | Loan Amount |
|---|---|---|---|
| Previous Owner | Cronin Maureen W | $120,000 | |
| Previous Owner | Warlick Wesley V | $36,800 |
Source: Public Records
Tax History
| Year | Tax Paid | Tax Assessment Tax Assessment Total Assessment is a certain percentage of the fair market value that is determined by local assessors to be the total taxable value of land and additions on the property. | Land | Improvement |
|---|---|---|---|---|
| 2025 | $3,413 | $200,970 | $40,195 | $160,775 |
| 2024 | $3,258 | $197,030 | $39,407 | $157,623 |
| 2023 | $3,157 | $193,166 | $38,634 | $154,532 |
| 2022 | $4,103 | $189,378 | $37,876 | $151,502 |
| 2021 | $2,971 | $185,664 | $37,133 | $148,531 |
| 2020 | $3,516 | $151,500 | $30,700 | $120,800 |
| 2019 | $2,502 | $143,000 | $29,000 | $114,000 |
| 2018 | $2,175 | $118,600 | $23,700 | $94,900 |
| 2017 | $2,077 | $113,000 | $22,600 | $90,400 |
| 2016 | $1,990 | $107,600 | $21,500 | $86,100 |
| 2015 | $1,944 | $105,000 | $21,000 | $84,000 |
| 2014 | $1,851 | $97,900 | $19,800 | $78,100 |
Source: Public Records
Map
Nearby Homes
Your Personal Tour Guide
Ask me questions while you tour the home.