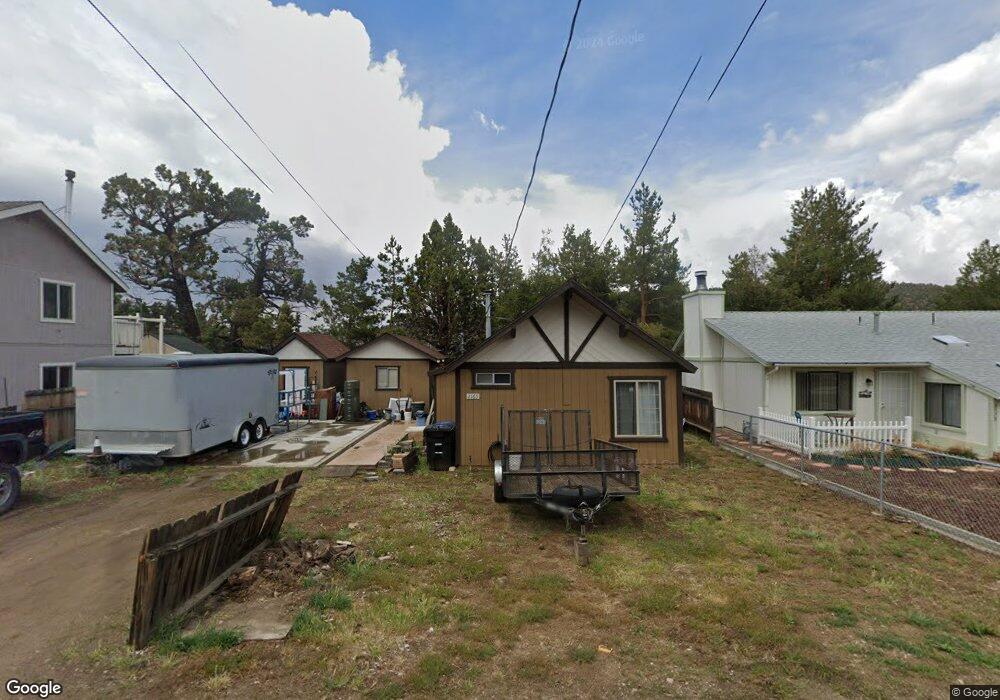
2165 7th Ln Big Bear City, CA 92314
Estimated Value: $234,000 - $288,000
1
Bed
1
Bath
688
Sq Ft
$370/Sq Ft
Est. Value
About This Home
This home is located at 2165 7th Ln, Big Bear City, CA 92314 and is currently estimated at $254,466, approximately $369 per square foot. 2165 7th Ln is a home located in San Bernardino County with nearby schools including Baldwin Lane Elementary School, Big Bear Middle School, and Big Bear High School.
Ownership History
Date
Name
Owned For
Owner Type
Purchase Details
Closed on
Mar 10, 2016
Sold by
Kohl John Robert
Bought by
Parde Kristianna M
Current Estimated Value
Home Financials for this Owner
Home Financials are based on the most recent Mortgage that was taken out on this home.
Original Mortgage
$48,750
Interest Rate
3.73%
Mortgage Type
New Conventional
Purchase Details
Closed on
Jan 27, 2014
Sold by
Kohl John Robert and Kohl Nancy Carole
Bought by
The Kohl Trust
Purchase Details
Closed on
Aug 8, 2002
Sold by
Gosswiller Michael A
Bought by
Kohl John R and Kohl Nancy C
Home Financials for this Owner
Home Financials are based on the most recent Mortgage that was taken out on this home.
Original Mortgage
$53,050
Interest Rate
6.37%
Mortgage Type
Purchase Money Mortgage
Create a Home Valuation Report for This Property
The Home Valuation Report is an in-depth analysis detailing your home's value as well as a comparison with similar homes in the area
Home Values in the Area
Average Home Value in this Area
Purchase History
| Date | Buyer | Sale Price | Title Company |
|---|---|---|---|
| Parde Kristianna M | $65,000 | Lawyers Title | |
| The Kohl Trust | -- | None Available | |
| Kohl John R | $59,000 | Fidelity National Title Ins |
Source: Public Records
Mortgage History
| Date | Status | Borrower | Loan Amount |
|---|---|---|---|
| Previous Owner | Parde Kristianna M | $48,750 | |
| Previous Owner | Kohl John R | $53,050 |
Source: Public Records
Tax History Compared to Growth
Tax History
| Year | Tax Paid | Tax Assessment Tax Assessment Total Assessment is a certain percentage of the fair market value that is determined by local assessors to be the total taxable value of land and additions on the property. | Land | Improvement |
|---|---|---|---|---|
| 2025 | $1,989 | $76,947 | $15,390 | $61,557 |
| 2024 | $1,989 | $75,438 | $15,088 | $60,350 |
| 2023 | $1,902 | $73,959 | $14,792 | $59,167 |
| 2022 | $1,807 | $72,509 | $14,502 | $58,007 |
| 2021 | $1,758 | $71,088 | $14,218 | $56,870 |
| 2020 | $1,736 | $70,359 | $14,072 | $56,287 |
| 2019 | $1,698 | $68,979 | $13,796 | $55,183 |
| 2018 | $1,629 | $67,626 | $13,525 | $54,101 |
| 2017 | $1,578 | $66,300 | $13,260 | $53,040 |
| 2016 | $1,612 | $72,189 | $18,048 | $54,141 |
| 2015 | $1,580 | $71,105 | $17,777 | $53,328 |
| 2014 | $1,548 | $69,712 | $17,429 | $52,283 |
Source: Public Records
Map
Nearby Homes