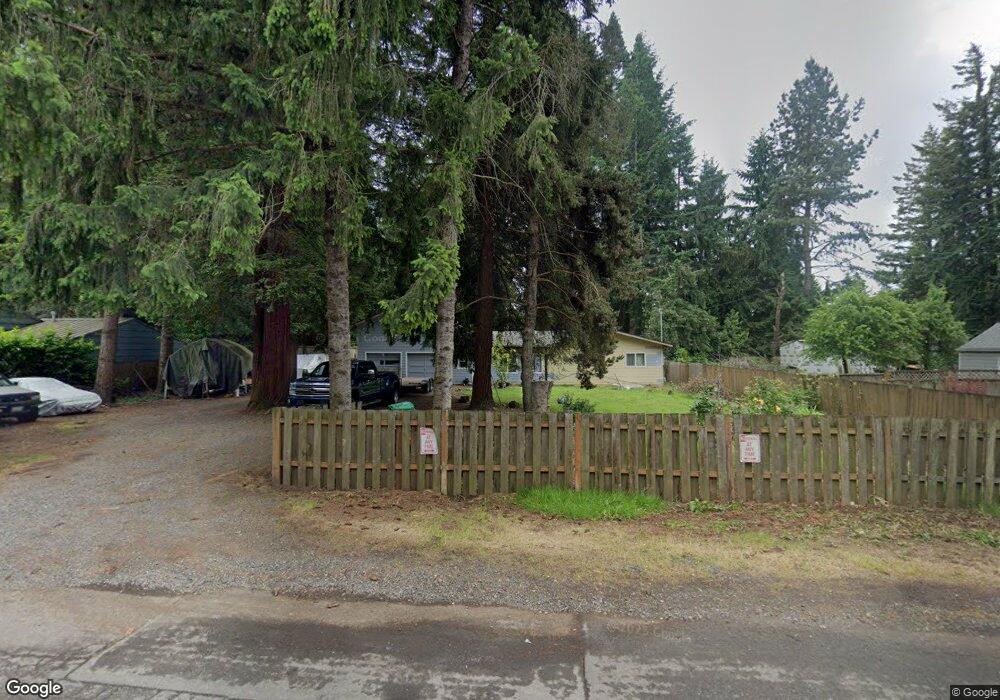
21650 SE Ash St Gresham, OR 97030
North Central NeighborhoodEstimated Value: $361,000 - $432,000
2
Beds
2
Baths
1,780
Sq Ft
$229/Sq Ft
Est. Value
About This Home
This home is located at 21650 SE Ash St, Gresham, OR 97030 and is currently estimated at $407,018, approximately $228 per square foot. 21650 SE Ash St is a home located in Multnomah County with nearby schools including North Gresham Elementary School, Clear Creek Middle School, and Gresham High School.
Ownership History
Date
Name
Owned For
Owner Type
Purchase Details
Closed on
Mar 24, 2015
Sold by
Fannie Mae
Bought by
Wellock Charles R and Wellock Mary Lou
Current Estimated Value
Purchase Details
Closed on
Sep 19, 2014
Sold by
Kibbe Stephan J
Bought by
Federal National Mortgage Association
Purchase Details
Closed on
Jul 25, 2014
Sold by
Gmac Mortgage Llc
Bought by
Federal National Mortgage Association
Purchase Details
Closed on
Nov 24, 2000
Sold by
Kibbe Stephen J
Bought by
Kibbe Stephen J and Kibbe Michelle L
Home Financials for this Owner
Home Financials are based on the most recent Mortgage that was taken out on this home.
Original Mortgage
$131,600
Interest Rate
7.86%
Mortgage Type
Purchase Money Mortgage
Purchase Details
Closed on
Jan 24, 1996
Sold by
Fowler Elvira K
Bought by
Kibbe Stephen J and Kibbe Michelle L
Home Financials for this Owner
Home Financials are based on the most recent Mortgage that was taken out on this home.
Original Mortgage
$107,158
Interest Rate
7.18%
Mortgage Type
FHA
Create a Home Valuation Report for This Property
The Home Valuation Report is an in-depth analysis detailing your home's value as well as a comparison with similar homes in the area
Home Values in the Area
Average Home Value in this Area
Purchase History
| Date | Buyer | Sale Price | Title Company |
|---|---|---|---|
| Wellock Charles R | $145,000 | Nextitle | |
| Federal National Mortgage Association | $272,381 | None Available | |
| Federal National Mortgage Association | -- | None Available | |
| Federal National Mortgage Association | -- | None Available | |
| Kibbe Stephen J | -- | -- | |
| Kibbe Stephen J | $108,000 | Chicago Title |
Source: Public Records
Mortgage History
| Date | Status | Borrower | Loan Amount |
|---|---|---|---|
| Previous Owner | Kibbe Stephen J | $131,600 | |
| Previous Owner | Kibbe Stephen J | $107,158 |
Source: Public Records
Tax History
| Year | Tax Paid | Tax Assessment Tax Assessment Total Assessment is a certain percentage of the fair market value that is determined by local assessors to be the total taxable value of land and additions on the property. | Land | Improvement |
|---|---|---|---|---|
| 2025 | $4,161 | $204,470 | -- | -- |
| 2024 | $3,983 | $198,520 | -- | -- |
| 2023 | $3,629 | $192,740 | $0 | $0 |
| 2022 | $3,527 | $187,130 | $0 | $0 |
| 2021 | $3,439 | $181,680 | $0 | $0 |
| 2020 | $3,235 | $176,390 | $0 | $0 |
| 2019 | $3,151 | $171,260 | $0 | $0 |
| 2018 | $3,004 | $166,280 | $0 | $0 |
| 2017 | $2,882 | $161,440 | $0 | $0 |
| 2016 | $2,541 | $156,740 | $0 | $0 |
| 2015 | $2,487 | $152,180 | $0 | $0 |
| 2014 | $2,426 | $147,750 | $0 | $0 |
Source: Public Records
Map
Nearby Homes
- 21553 SE Ankeny Terrace
- 21525 SE Oak St
- 210 SE 218th Ave
- 132 SE 214th Ave
- 209 SE 214th Ave
- 21400 SE Stark St Unit 2
- 21532 SE Alder St
- 21260 SE Stark St
- 21016 SE Stark St Unit 71
- 21016 SE Stark St Unit 69
- 872 NE Pacific Dr
- 1035 SE 225th Ave
- 760 NE Pacific Dr
- 2730 NE Roberts Ave
- 22285 NE Park Ln
- 1305 NE Village St
- 1367 NE Market Dr
- 150 NE 202nd Ave
- 2013 NW Bella Vista Dr
- 1510 NE Village St
- 21712 SE Ash St
- 21636 SE Ash St
- 21657 SE Oak St
- 21701 SE Oak St
- 21726 SE Ash St
- 21633 SE Oak St
- 21730 SE Ash St
- 21649 SE Ash St
- 21617 SE Oak St
- 21713 SE Oak St
- 21620 SE Ash St
- 21639 SE Ash St
- 21711 SE Ash St
- 21744 SE Ash St
- 21637 SE Ash St
- 21727 SE Oak St
- 21601 SE Ash St
- 21725 SE Ash St
- 21605 SE Oak St
- 21731 SE Ash St
Your Personal Tour Guide
Ask me questions while you tour the home.