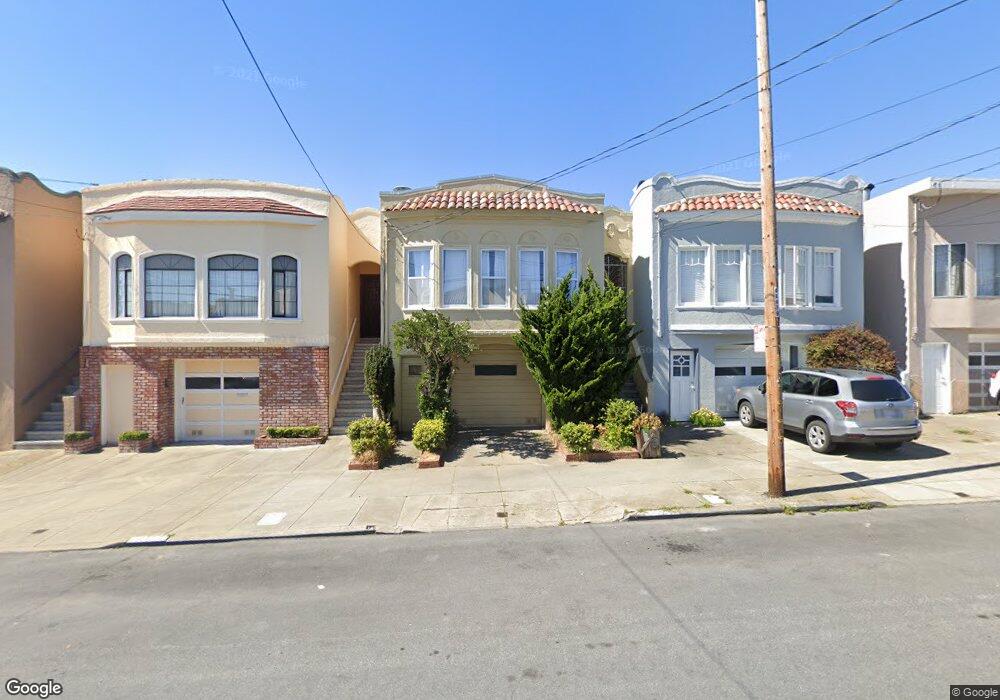
2167 21st Ave San Francisco, CA 94116
Parkside NeighborhoodEstimated Value: $1,331,000 - $1,516,000
2
Beds
1
Bath
1,472
Sq Ft
$985/Sq Ft
Est. Value
About This Home
This home is located at 2167 21st Ave, San Francisco, CA 94116 and is currently estimated at $1,450,054, approximately $985 per square foot. 2167 21st Ave is a home located in San Francisco County with nearby schools including Dianne Feinstein Elementary, Aptos Middle School, and Cornerstone Academy-Lawton Campus.
Ownership History
Date
Name
Owned For
Owner Type
Purchase Details
Closed on
Mar 8, 2021
Sold by
Lum Hung Cherk
Bought by
Cherk Lum Hung Separate Property Trust and Hung
Current Estimated Value
Purchase Details
Closed on
Oct 31, 2011
Sold by
Hung Cherk Lum
Bought by
Hung Cherk Lum
Purchase Details
Closed on
Mar 7, 2005
Sold by
Hung Sau Ying and Hung Cherk Lum
Bought by
Hung Cherk Lum
Home Financials for this Owner
Home Financials are based on the most recent Mortgage that was taken out on this home.
Original Mortgage
$360,000
Interest Rate
5.75%
Mortgage Type
New Conventional
Purchase Details
Closed on
Feb 14, 2002
Sold by
Hung Cherk Lum and Hung Sau Ying
Bought by
Hung Cherk Lum and Hung Sau Ying
Home Financials for this Owner
Home Financials are based on the most recent Mortgage that was taken out on this home.
Original Mortgage
$265,000
Interest Rate
7.04%
Purchase Details
Closed on
Nov 27, 1993
Sold by
Hungm Jeannie and Hung Edmond
Bought by
Hung Cherk Lum and Hung Sau Ying
Create a Home Valuation Report for This Property
The Home Valuation Report is an in-depth analysis detailing your home's value as well as a comparison with similar homes in the area
Home Values in the Area
Average Home Value in this Area
Purchase History
| Date | Buyer | Sale Price | Title Company |
|---|---|---|---|
| Cherk Lum Hung Separate Property Trust | -- | -- | |
| Hung Cherk Lum | -- | None Available | |
| Hung Cherk Lum | -- | Stewart Title Company | |
| Hung Cherk Lum | -- | -- |
Source: Public Records
Mortgage History
| Date | Status | Borrower | Loan Amount |
|---|---|---|---|
| Previous Owner | Hung Cherk Lum | $360,000 | |
| Previous Owner | Hung Cherk Lum | $265,000 | |
| Previous Owner | Hung Cherk Lum | $265,000 | |
| Previous Owner | Hung Cherk Lum | $100,000 |
Source: Public Records
Tax History Compared to Growth
Tax History
| Year | Tax Paid | Tax Assessment Tax Assessment Total Assessment is a certain percentage of the fair market value that is determined by local assessors to be the total taxable value of land and additions on the property. | Land | Improvement |
|---|---|---|---|---|
| 2025 | $6,508 | $556,976 | $306,247 | $250,729 |
| 2024 | $6,508 | $546,056 | $300,243 | $245,813 |
| 2023 | $6,416 | $535,350 | $294,356 | $240,994 |
| 2022 | $6,303 | $524,854 | $288,585 | $236,269 |
| 2021 | $6,113 | $514,564 | $282,927 | $231,637 |
| 2020 | $6,131 | $509,288 | $280,026 | $229,262 |
| 2019 | $5,921 | $499,303 | $274,536 | $224,767 |
| 2018 | $5,723 | $489,513 | $269,153 | $220,360 |
| 2017 | $5,655 | $479,916 | $263,876 | $216,040 |
| 2016 | $5,545 | $470,506 | $258,702 | $211,804 |
| 2015 | $5,743 | $463,440 | $254,817 | $208,623 |
| 2014 | $5,724 | $454,363 | $249,826 | $204,537 |
Source: Public Records
Map
Nearby Homes
- 2067 20th Ave
- 2201 17th Ave
- 2418 21st Ave
- 1532 Pacheco St
- 2434 20th Ave
- 634-636 Taraval St
- 1640 1644 Taraval St
- 2383 2385 26th Ave
- 2150 Ulloa St
- 2212 15th Ave
- 353 Rivera St
- 1983 15th Ave
- 1851 21st Ave
- 2123 Funston Ave
- 1885 16th Ave
- 1815 18th Ave
- 1927 Taraval St
- 1767 21st Ave
- 1751 25th Ave
- 18 Cragmont Ave