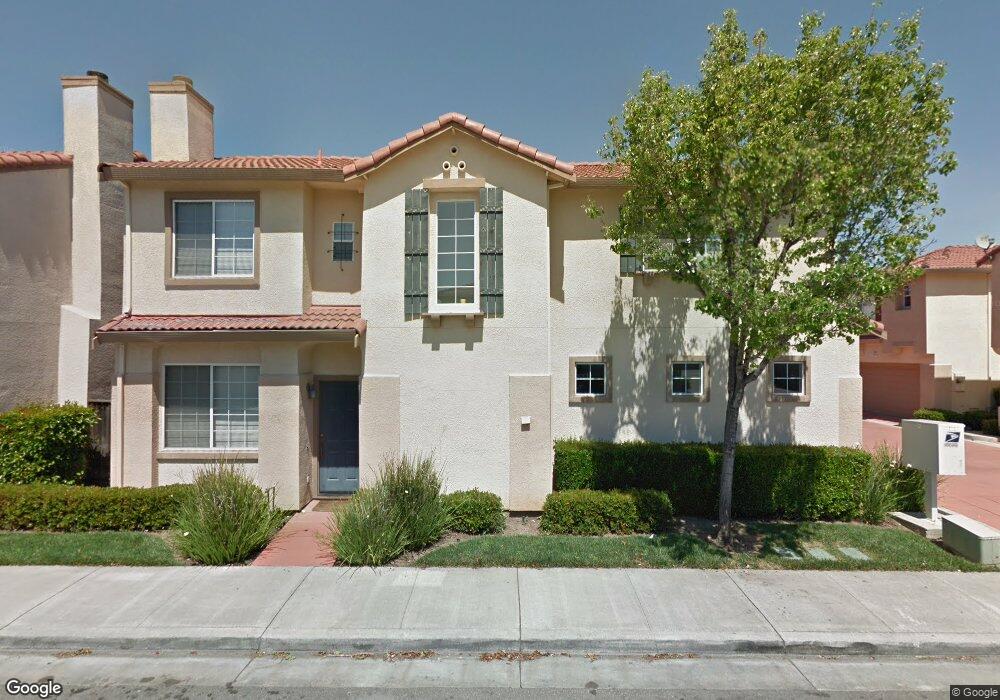
2167 Esperanca Ave Santa Clara, CA 95054
North Santa Clara NeighborhoodEstimated Value: $1,093,000 - $1,528,643
4
Beds
3
Baths
1,685
Sq Ft
$817/Sq Ft
Est. Value
About This Home
This home is located at 2167 Esperanca Ave, Santa Clara, CA 95054 and is currently estimated at $1,376,911, approximately $817 per square foot. 2167 Esperanca Ave is a home located in Santa Clara County with nearby schools including Kathryn Hughes Elementary School, Buchser Middle School, and Santa Clara High School.
Ownership History
Date
Name
Owned For
Owner Type
Purchase Details
Closed on
Jan 27, 2017
Sold by
Kim Edward Hanjoo and Kim Edward H
Bought by
Kim Edward Hanjoo
Current Estimated Value
Purchase Details
Closed on
Jan 26, 2017
Sold by
Weiss Junghi C
Bought by
Kim Edward Hanjoo
Purchase Details
Closed on
Oct 18, 2002
Sold by
Kim Edward H and Weiss Junghi C
Bought by
Weiss Junghi C and Kim Edward H
Home Financials for this Owner
Home Financials are based on the most recent Mortgage that was taken out on this home.
Original Mortgage
$274,000
Interest Rate
5.99%
Purchase Details
Closed on
Dec 30, 1998
Sold by
Weiss Anton Max
Bought by
Weiss Junghi C
Purchase Details
Closed on
Oct 12, 1998
Sold by
First American Title Guaranty Company
Bought by
Weiss Junghi C and Kim Edward H
Home Financials for this Owner
Home Financials are based on the most recent Mortgage that was taken out on this home.
Original Mortgage
$286,700
Interest Rate
6.25%
Create a Home Valuation Report for This Property
The Home Valuation Report is an in-depth analysis detailing your home's value as well as a comparison with similar homes in the area
Home Values in the Area
Average Home Value in this Area
Purchase History
| Date | Buyer | Sale Price | Title Company |
|---|---|---|---|
| Kim Edward Hanjoo | -- | None Available | |
| Kim Edward Hanjoo | -- | None Available | |
| Weiss Junghi C | -- | Alliance Title Company | |
| Kim Edward H | -- | Alliance Title Company | |
| Weiss Junghi C | -- | First American Title Guarant | |
| Weiss Junghi C | $358,500 | First American Title Guarant |
Source: Public Records
Mortgage History
| Date | Status | Borrower | Loan Amount |
|---|---|---|---|
| Previous Owner | Kim Edward H | $274,000 | |
| Previous Owner | Weiss Junghi C | $286,700 |
Source: Public Records
Tax History Compared to Growth
Tax History
| Year | Tax Paid | Tax Assessment Tax Assessment Total Assessment is a certain percentage of the fair market value that is determined by local assessors to be the total taxable value of land and additions on the property. | Land | Improvement |
|---|---|---|---|---|
| 2025 | $6,542 | $561,891 | $313,534 | $248,357 |
| 2024 | $6,542 | $550,875 | $307,387 | $243,488 |
| 2023 | $6,476 | $540,074 | $301,360 | $238,714 |
| 2022 | $6,370 | $529,485 | $295,451 | $234,034 |
| 2021 | $6,344 | $519,104 | $289,658 | $229,446 |
| 2020 | $6,229 | $513,782 | $286,688 | $227,094 |
| 2019 | $6,222 | $503,709 | $281,067 | $222,642 |
| 2018 | $5,825 | $493,833 | $275,556 | $218,277 |
| 2017 | $5,796 | $484,151 | $270,153 | $213,998 |
| 2016 | $5,701 | $474,658 | $264,856 | $209,802 |
| 2015 | $5,679 | $467,529 | $260,878 | $206,651 |
| 2014 | $5,392 | $458,371 | $255,768 | $202,603 |
Source: Public Records
Map
Nearby Homes
- 4676 Wilcox Ave
- 4503 Cheeney St
- 4699 Snead Dr
- 1901 Garzoni Place Unit 405
- 2313 Villa Place
- 1898 Garzoni Place
- 1883 Agnew Rd Unit 301
- 1883 Agnew Rd Unit 341
- 1883 Agnew Rd Unit 367
- 2200 Agnew Rd Unit 212
- 2200 Agnew Rd Unit 118
- 1752 Beech St
- 1900 Chestnut St
- 4464 Laird Cir
- 930 Clyde Ave
- 920 Clyde Ave
- 4012 Fitzpatrick Way Unit 3
- 783 Laurie Ave
- 3901 Lick Mill Blvd Unit 358
- 3901 Lick Mill Blvd Unit 430
- 2165 Esperanca Ave
- 2169 Esperanca Ave
- 2171 Esperanca Ave
- 2153 Esperanca Ave
- 2163 Esperanca Ave
- 2155 Esperanca Ave
- 2160 Esperanca Ave
- 2173 Esperanca Ave
- 2161 Esperanca Ave
- 2162 Esperanca Ave
- 2159 Esperanca Ave
- 2158 Esperanca Ave
- 2175 Esperanca Ave
- 2157 Esperanca Ave
- 2164 Esperanca Ave
- 2183 Esperanca Ave
- 4642 Wilcox Ave
- 2181 Esperanca Ave
- 4640 Wilcox Ave
- 2177 Esperanca Ave