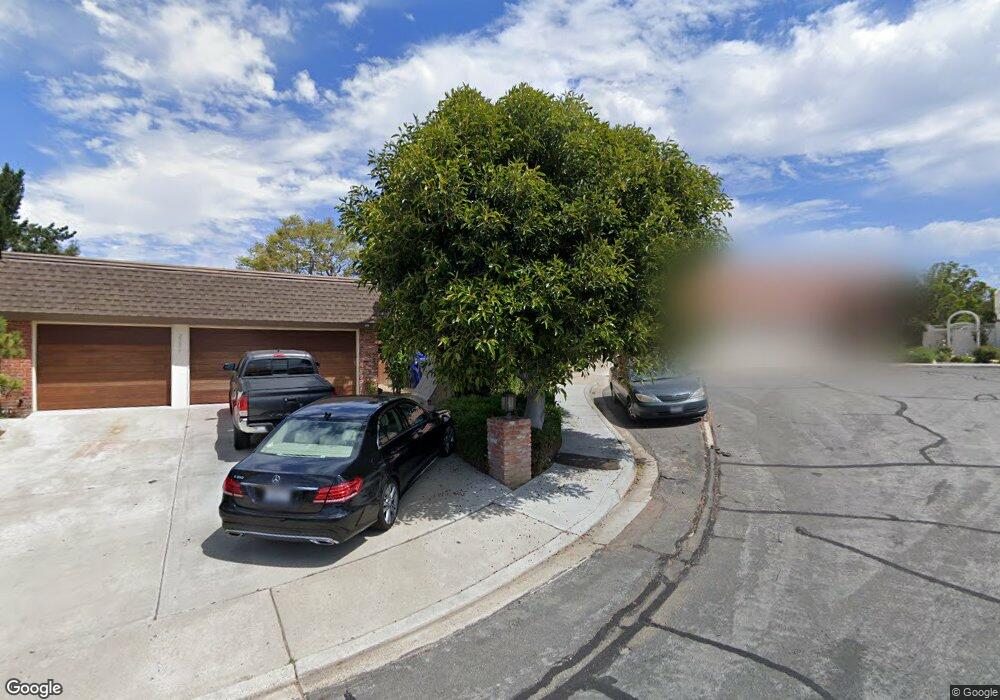
2168 Harbour Heights Rd San Diego, CA 92109
Pacific Beach NeighborhoodEstimated Value: $2,358,000 - $2,599,000
4
Beds
3
Baths
3,013
Sq Ft
$838/Sq Ft
Est. Value
About This Home
This home is located at 2168 Harbour Heights Rd, San Diego, CA 92109 and is currently estimated at $2,525,531, approximately $838 per square foot. 2168 Harbour Heights Rd is a home located in San Diego County with nearby schools including Sessions Elementary School, Pacific Beach Middle, and Mission Bay High School.
Ownership History
Date
Name
Owned For
Owner Type
Purchase Details
Closed on
Jun 26, 2020
Sold by
Jafari Ray and Eskandari Safa
Bought by
Jafari Ray and Eskandari Safa
Current Estimated Value
Home Financials for this Owner
Home Financials are based on the most recent Mortgage that was taken out on this home.
Original Mortgage
$505,000
Outstanding Balance
$446,114
Interest Rate
2.9%
Mortgage Type
New Conventional
Estimated Equity
$2,079,417
Purchase Details
Closed on
Jun 16, 2010
Sold by
U S Bank National Association
Bought by
Jafari Ray and Eskandari Safa
Home Financials for this Owner
Home Financials are based on the most recent Mortgage that was taken out on this home.
Original Mortgage
$613,200
Interest Rate
4.68%
Mortgage Type
New Conventional
Purchase Details
Closed on
Feb 8, 2010
Sold by
Busalacchi Joseph Paul and Busalacchi Candace M
Bought by
Us Bank National Association
Create a Home Valuation Report for This Property
The Home Valuation Report is an in-depth analysis detailing your home's value as well as a comparison with similar homes in the area
Home Values in the Area
Average Home Value in this Area
Purchase History
| Date | Buyer | Sale Price | Title Company |
|---|---|---|---|
| Jafari Ray | -- | Ticor Title | |
| Jafari Ray | $766,500 | Chicago Title Company | |
| Us Bank National Association | $821,698 | Servicelink |
Source: Public Records
Mortgage History
| Date | Status | Borrower | Loan Amount |
|---|---|---|---|
| Open | Jafari Ray | $505,000 | |
| Closed | Jafari Ray | $613,200 |
Source: Public Records
Tax History Compared to Growth
Tax History
| Year | Tax Paid | Tax Assessment Tax Assessment Total Assessment is a certain percentage of the fair market value that is determined by local assessors to be the total taxable value of land and additions on the property. | Land | Improvement |
|---|---|---|---|---|
| 2025 | $11,772 | $982,005 | $768,697 | $213,308 |
| 2024 | $11,772 | $962,751 | $753,625 | $209,126 |
| 2023 | $11,511 | $943,875 | $738,849 | $205,026 |
| 2022 | $11,204 | $925,368 | $724,362 | $201,006 |
| 2021 | $11,125 | $907,224 | $710,159 | $197,065 |
| 2020 | $10,990 | $897,923 | $702,878 | $195,045 |
| 2019 | $10,792 | $880,318 | $689,097 | $191,221 |
| 2018 | $10,088 | $863,058 | $675,586 | $187,472 |
| 2017 | $80 | $846,137 | $662,340 | $183,797 |
| 2016 | $9,689 | $829,547 | $649,353 | $180,194 |
| 2015 | $9,545 | $817,088 | $639,600 | $177,488 |
| 2014 | $9,393 | $801,084 | $627,072 | $174,012 |
Source: Public Records
Map
Nearby Homes
- 2104 Crownhill Rd
- 5227 Middleton Rd
- 2252 Soledad Rancho Rd
- 2223 Caminito Preciosa Sur Unit 111
- 2294 Caminito Preciosa Norte
- 1981 Wilbur Ave
- 1897 Malden St
- 1978 Beryl St
- 5497 Coral Reef Ave
- 5259 Pacifica Dr
- 2315 Geranium St
- 1645 Los Altos Rd
- 1717 Archer St
- 5108 Gordon Ln
- 5150 Gordon Ln
- 4964 Kendall St
- 2481 La Marque St
- 1715 Malden St
- 2318 Chalcedony St
- 2128 Missouri St
- 2192 Harbour Heights Rd
- 5225 Harbour Heights Ct
- 2156 Harbour Heights Rd
- 5236 Soledad Mountain Rd
- 5228 Soledad Mountain Rd
- 5235 Harbour Heights Ct
- 5242 Soledad Mountain Rd
- 5220 Soledad Mountain Rd
- 5250 Soledad Mountain Rd
- 2169 Harbour Heights Rd
- 2181 Harbour Heights Rd
- 5214 Soledad Mountain Rd Unit 1
- 2157 Harbour Heights Rd
- 5258 Soledad Mountain Rd Unit 5113
- 5210 Harbour Heights Ct
- 5220 Harbour Heights Ct
- 2145 Harbour Heights Rd
- 5208 Soledad Mountain Rd
- 5266 Soledad Mountain Rd
- 5240 Harbour Heights Ct