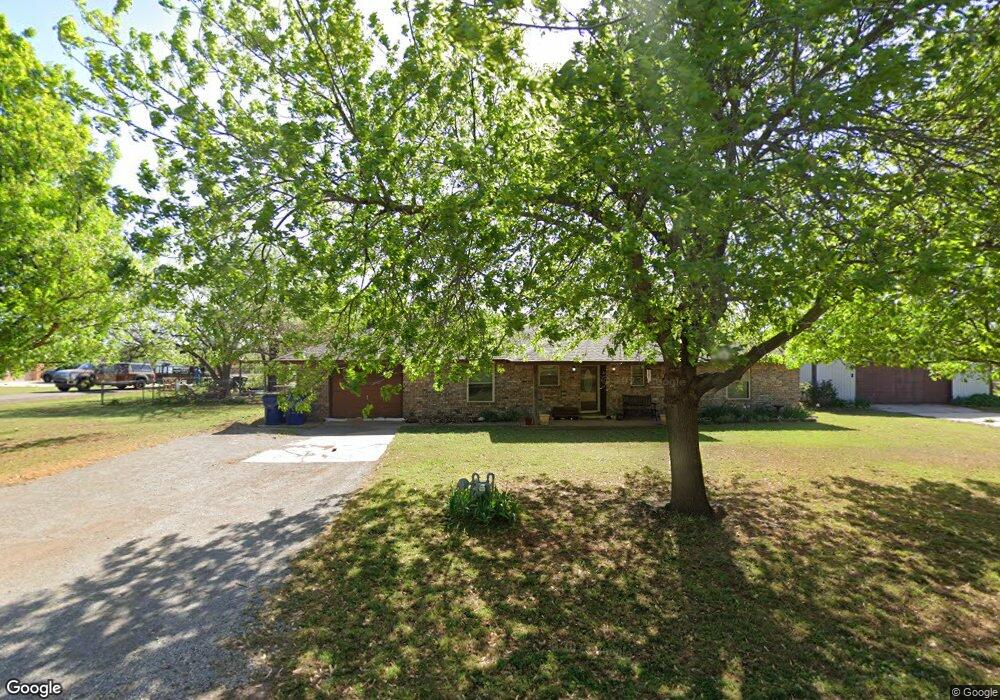
217 3rd St NE Piedmont, OK 73078
Estimated Value: $192,178 - $244,000
3
Beds
2
Baths
1,238
Sq Ft
$171/Sq Ft
Est. Value
About This Home
This home is located at 217 3rd St NE, Piedmont, OK 73078 and is currently estimated at $211,545, approximately $170 per square foot. 217 3rd St NE is a home located in Canadian County with nearby schools including Piedmont Elementary School, Piedmont Middle School, and Piedmont Intermediate Elementary School.
Ownership History
Date
Name
Owned For
Owner Type
Purchase Details
Closed on
Jun 11, 2012
Sold by
Wells Suzanne M and Robinson Gary
Bought by
Johnson Sabre R
Current Estimated Value
Home Financials for this Owner
Home Financials are based on the most recent Mortgage that was taken out on this home.
Original Mortgage
$117,727
Outstanding Balance
$81,282
Interest Rate
3.75%
Mortgage Type
FHA
Estimated Equity
$130,263
Purchase Details
Closed on
Jun 3, 2010
Sold by
Wells Robert Brent
Bought by
Wells Suzanne M
Home Financials for this Owner
Home Financials are based on the most recent Mortgage that was taken out on this home.
Original Mortgage
$75,153
Interest Rate
5.5%
Mortgage Type
FHA
Purchase Details
Closed on
Aug 10, 2000
Sold by
Wells Robert B
Purchase Details
Closed on
Feb 12, 1990
Create a Home Valuation Report for This Property
The Home Valuation Report is an in-depth analysis detailing your home's value as well as a comparison with similar homes in the area
Home Values in the Area
Average Home Value in this Area
Purchase History
| Date | Buyer | Sale Price | Title Company |
|---|---|---|---|
| Johnson Sabre R | $120,000 | Multiple | |
| Wells Suzanne M | -- | Capitol Abstract & Title Co | |
| -- | -- | -- | |
| -- | $41,000 | -- |
Source: Public Records
Mortgage History
| Date | Status | Borrower | Loan Amount |
|---|---|---|---|
| Open | Johnson Sabre R | $117,727 | |
| Previous Owner | Wells Suzanne M | $75,153 |
Source: Public Records
Tax History Compared to Growth
Tax History
| Year | Tax Paid | Tax Assessment Tax Assessment Total Assessment is a certain percentage of the fair market value that is determined by local assessors to be the total taxable value of land and additions on the property. | Land | Improvement |
|---|---|---|---|---|
| 2024 | $1,613 | $15,933 | $2,640 | $13,293 |
| 2023 | $1,613 | $15,174 | $2,640 | $12,534 |
| 2022 | $1,551 | $14,451 | $2,640 | $11,811 |
| 2021 | $1,530 | $13,763 | $2,640 | $11,123 |
| 2020 | $1,482 | $13,108 | $2,640 | $10,468 |
| 2019 | $1,416 | $13,176 | $2,640 | $10,536 |
| 2018 | $1,366 | $12,548 | $2,640 | $9,908 |
| 2017 | $1,361 | $12,548 | $2,640 | $9,908 |
| 2016 | $1,361 | $13,039 | $2,640 | $10,399 |
| 2015 | $1,191 | $12,383 | $2,640 | $9,743 |
| 2014 | $1,191 | $11,956 | $2,640 | $9,316 |
Source: Public Records
Map
Nearby Homes
- 211 Madison Ave NE
- 415 Washington Ave E
- 220 Jackson Ave NW
- 1124 Burlywood Ln
- 1391 Hickory Trail
- 4629 Red Cedar Ave
- 4559 Red Cedar Ave
- 4175 White Ash Dr
- 4426 Pinon Ln
- 1223 Mahogany Ln
- 1164 Walnut Brook Rd
- 1245 Mahogany Ln
- 1255 Burlywood Ln
- 1138 Copper Ridge Cir
- 1116 Copper Ridge Cir
- 414 Harrison Ave NW
- OZARK Plan at Town Central - Autumn Chase
- CALI Plan at Town Central - Autumn Chase
- KINGSTON Plan at Town Central - Autumn Chase
- LAREDO Plan at Town Central - Autumn Chase
- 312 Madison Ave NE
- 204 3rd St NE
- 222 Madison Ave NE
- 306 3rd St NE
- 221 Jefferson Ave NE
- 319 Madison Ave NE
- 219 Madison Ave NE
- 213 Jefferson Ave NE
- 116 3rd St NE
- 314 Jefferson Ave NE
- 220 Jefferson Ave NE
- 318 3rd St NE
- 205 Jefferson Ave NE
- 210 Jefferson Ave NE
- 202 Jefferson Ave NE
- 212 Monroe Ave NE
- 104 3rd St NE
- 313 Adams Ave NE
- 118 N 2nd St NE
- 221 Adams Ave NE