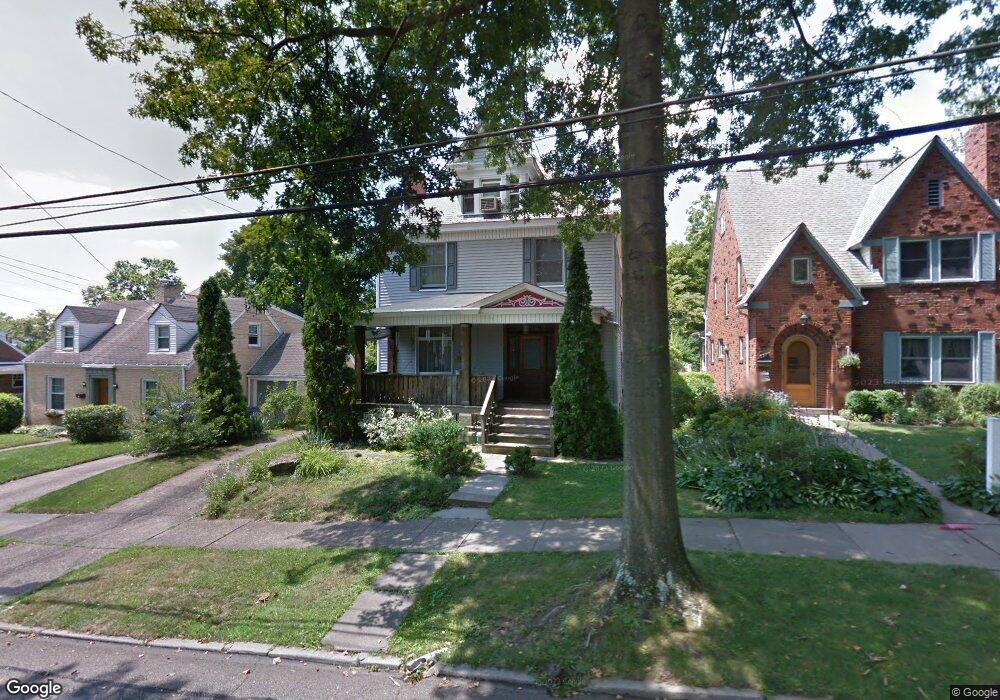
217 5th St Oakmont, PA 15139
Estimated Value: $354,000 - $450,000
4
Beds
3
Baths
3,074
Sq Ft
$131/Sq Ft
Est. Value
About This Home
This home is located at 217 5th St, Oakmont, PA 15139 and is currently estimated at $404,197, approximately $131 per square foot. 217 5th St is a home located in Allegheny County with nearby schools including Riverview High School and Shady Side Academy Middle School.
Ownership History
Date
Name
Owned For
Owner Type
Purchase Details
Closed on
Jun 16, 2018
Sold by
Knoche Scott C and Knoche Kelly
Bought by
Knoche Scott C and Knoche Kelly
Current Estimated Value
Purchase Details
Closed on
Jul 6, 2016
Sold by
Lance Patricia J
Bought by
Knoche Scott C and Kopolovich Kelly
Home Financials for this Owner
Home Financials are based on the most recent Mortgage that was taken out on this home.
Original Mortgage
$220,924
Outstanding Balance
$176,591
Interest Rate
3.62%
Mortgage Type
FHA
Estimated Equity
$227,606
Purchase Details
Closed on
Nov 30, 1978
Bought by
Lance Patricia J
Create a Home Valuation Report for This Property
The Home Valuation Report is an in-depth analysis detailing your home's value as well as a comparison with similar homes in the area
Home Values in the Area
Average Home Value in this Area
Purchase History
| Date | Buyer | Sale Price | Title Company |
|---|---|---|---|
| Knoche Scott C | -- | None Available | |
| Knoche Scott C | $225,000 | Trg Closing Services | |
| Lance Patricia J | $25,000 | -- |
Source: Public Records
Mortgage History
| Date | Status | Borrower | Loan Amount |
|---|---|---|---|
| Open | Knoche Scott C | $220,924 |
Source: Public Records
Tax History Compared to Growth
Tax History
| Year | Tax Paid | Tax Assessment Tax Assessment Total Assessment is a certain percentage of the fair market value that is determined by local assessors to be the total taxable value of land and additions on the property. | Land | Improvement |
|---|---|---|---|---|
| 2025 | $5,803 | $178,000 | $45,300 | $132,700 |
| 2024 | $5,803 | $178,000 | $45,300 | $132,700 |
| 2023 | $5,719 | $178,000 | $45,300 | $132,700 |
| 2022 | $5,648 | $178,000 | $45,300 | $132,700 |
| 2021 | $842 | $178,000 | $45,300 | $132,700 |
| 2020 | $5,648 | $178,000 | $45,300 | $132,700 |
| 2019 | $5,601 | $178,000 | $45,300 | $132,700 |
| 2018 | $1,732 | $178,000 | $45,300 | $132,700 |
| 2017 | $4,775 | $178,000 | $45,300 | $132,700 |
| 2016 | $731 | $154,500 | $45,300 | $109,200 |
| 2015 | $731 | $154,500 | $45,300 | $109,200 |
| 2014 | $4,725 | $154,500 | $45,300 | $109,200 |
Source: Public Records
Map
Nearby Homes