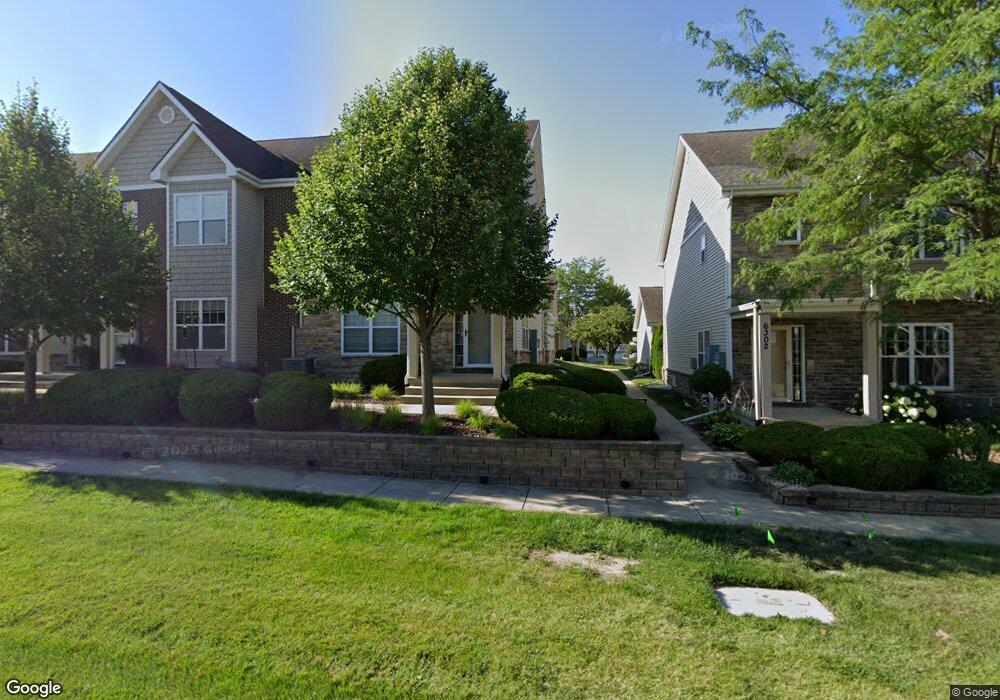
217 63rd St West Des Moines, IA 50266
Estimated Value: $286,000 - $345,000
3
Beds
3
Baths
1,631
Sq Ft
$191/Sq Ft
Est. Value
About This Home
This home is located at 217 63rd St, West Des Moines, IA 50266 and is currently estimated at $310,967, approximately $190 per square foot. 217 63rd St is a home located in Dallas County with nearby schools including Woodland Hills Elementary, Timberline School, and Prairieview Middle School.
Ownership History
Date
Name
Owned For
Owner Type
Purchase Details
Closed on
Apr 10, 2024
Sold by
Nguyen Hong
Bought by
Hooker Family Trust and Hooker
Current Estimated Value
Purchase Details
Closed on
Oct 31, 2022
Sold by
Price Nathan and Price Kimberly
Bought by
Nguyen Hong
Purchase Details
Closed on
Dec 19, 2019
Sold by
Krohn John and Krohn Mary
Bought by
Price Nathan Joseph and Price Kimberly Ann
Home Financials for this Owner
Home Financials are based on the most recent Mortgage that was taken out on this home.
Original Mortgage
$160,000
Interest Rate
3.7%
Mortgage Type
Commercial
Purchase Details
Closed on
Apr 30, 2014
Sold by
Elle Llc
Bought by
Krohn John and Krohn Mary
Home Financials for this Owner
Home Financials are based on the most recent Mortgage that was taken out on this home.
Original Mortgage
$173,600
Interest Rate
4.33%
Mortgage Type
Future Advance Clause Open End Mortgage
Create a Home Valuation Report for This Property
The Home Valuation Report is an in-depth analysis detailing your home's value as well as a comparison with similar homes in the area
Home Values in the Area
Average Home Value in this Area
Purchase History
| Date | Buyer | Sale Price | Title Company |
|---|---|---|---|
| Hooker Family Trust | $310,500 | None Listed On Document | |
| Hooker Family Trust | $310,500 | None Listed On Document | |
| Nguyen Hong | $305,000 | -- | |
| Nguyen Hong | $305,000 | None Listed On Document | |
| Price Nathan Joseph | $200,000 | None Available | |
| Krohn John | $194,000 | None Available |
Source: Public Records
Mortgage History
| Date | Status | Borrower | Loan Amount |
|---|---|---|---|
| Previous Owner | Price Nathan Joseph | $160,000 | |
| Previous Owner | Krohn John | $173,600 |
Source: Public Records
Tax History Compared to Growth
Tax History
| Year | Tax Paid | Tax Assessment Tax Assessment Total Assessment is a certain percentage of the fair market value that is determined by local assessors to be the total taxable value of land and additions on the property. | Land | Improvement |
|---|---|---|---|---|
| 2024 | $4,904 | $295,640 | $35,000 | $260,640 |
| 2023 | $4,904 | $295,640 | $35,000 | $260,640 |
| 2022 | $4,310 | $261,850 | $35,000 | $226,850 |
| 2021 | $4,310 | $232,940 | $35,000 | $197,940 |
| 2020 | $4,386 | $229,520 | $35,000 | $194,520 |
| 2019 | $4,276 | $229,520 | $35,000 | $194,520 |
| 2018 | $4,276 | $213,340 | $35,000 | $178,340 |
| 2017 | $4,232 | $213,340 | $35,000 | $178,340 |
| 2016 | $4,438 | $205,840 | $35,000 | $170,840 |
| 2015 | $4,306 | $221,100 | $0 | $0 |
| 2014 | $4,184 | $221,100 | $0 | $0 |
Source: Public Records
Map
Nearby Homes
- 6285 Wistful Vista Dr
- 204 Cambridge Dr
- 196 Cambridge Dr
- 6200 Ep True Pkwy Unit 260
- 6200 Ep True Pkwy Unit 602
- 6200 Ep True Pkwy Unit 303
- 6200 Ep True Pkwy Unit 124
- 6440 Ep True Pkwy Unit 3205
- 6440 Ep True Pkwy Unit 2205
- 6440 Ep True Pkwy Unit 1108
- 6350 Coachlight Dr Unit 1307
- 6350 Coachlight Dr Unit 2102
- 6350 Coachlight Dr Unit 3204
- 5783 Beechtree Dr
- 5930 Fairway Ct
- 5925 Ep True Pkwy Unit 25
- 5925 Ep True Pkwy Unit 22
- 645 65th Place Unit 165
- 1252 S Radley St
- 1299 S Radley St
- 217 63rd St Unit 20101
- 213 63rd St
- 205 63rd St
- 205 63rd St Unit 20104
- 197 63rd St Unit 20106
- 201 63rd St Unit 20105
- 189 63rd St Unit 20108
- 209 63rd St Unit 20103
- 6250 Beechtree Dr Unit 19105
- 6250 Beechtree Dr Unit 19101
- 6260 Beechtree Dr Unit 19104
- 6270 Beechtree Dr Unit 19103
- 6280 Beechtree Dr Unit 19102
- 6240 Beechtree Dr Unit 19106
- 228 63rd St
- 224 63rd St
- 212 63rd St
- 6302 Beechtree Dr Unit 18106
- 6322 Beechtree Dr Unit 18101
- 6318 Beechtree Dr Unit 18102