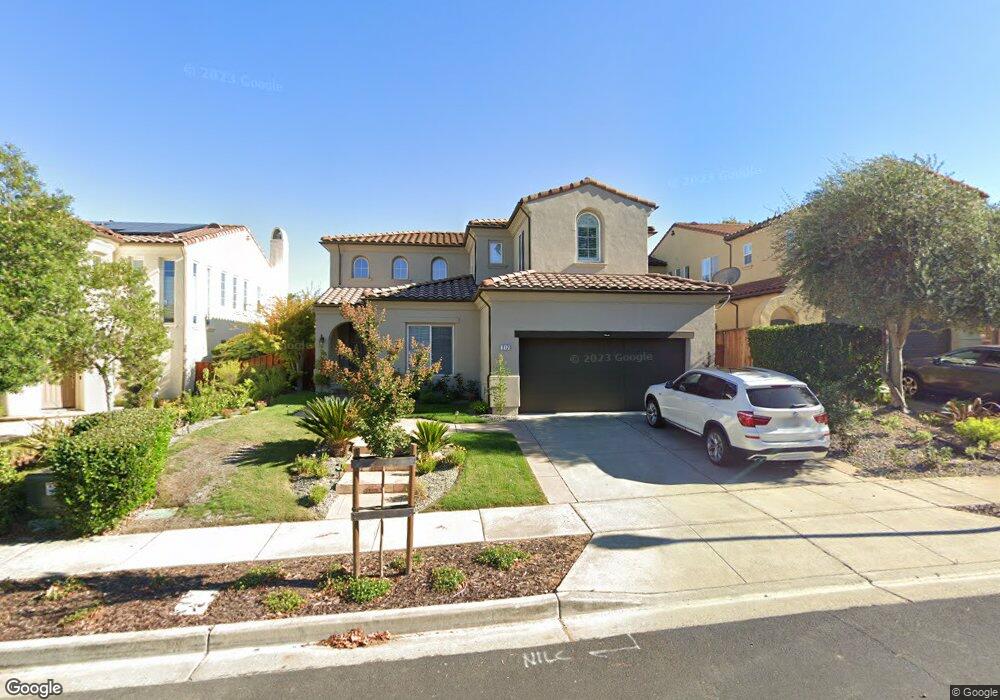
217 Aspenwood Ct San Ramon, CA 94582
Gale Ranch-Windemere NeighborhoodEstimated Value: $1,926,000 - $2,111,000
4
Beds
3
Baths
2,373
Sq Ft
$852/Sq Ft
Est. Value
About This Home
This home is located at 217 Aspenwood Ct, San Ramon, CA 94582 and is currently estimated at $2,022,210, approximately $852 per square foot. 217 Aspenwood Ct is a home located in Contra Costa County with nearby schools including Coyote Creek Elementary School, Gale Ranch Middle School, and Dougherty Valley High School.
Ownership History
Date
Name
Owned For
Owner Type
Purchase Details
Closed on
May 2, 2019
Sold by
Forte Patrick J and Forte Dava E
Bought by
Sim Chung Do Hyun and Sim Lee Hye
Current Estimated Value
Home Financials for this Owner
Home Financials are based on the most recent Mortgage that was taken out on this home.
Original Mortgage
$917,000
Outstanding Balance
$802,937
Interest Rate
4%
Mortgage Type
New Conventional
Estimated Equity
$1,219,273
Purchase Details
Closed on
Jan 17, 2002
Sold by
Forte Patrick J and Forte Dava E
Bought by
Forte Patrick J and Forte Dava E
Home Financials for this Owner
Home Financials are based on the most recent Mortgage that was taken out on this home.
Original Mortgage
$228,000
Interest Rate
7.11%
Mortgage Type
Purchase Money Mortgage
Purchase Details
Closed on
Dec 22, 1999
Sold by
Shapell Industries Inc
Bought by
Forte Patrick J and Dunn Dava E
Home Financials for this Owner
Home Financials are based on the most recent Mortgage that was taken out on this home.
Original Mortgage
$232,000
Interest Rate
7.72%
Mortgage Type
Purchase Money Mortgage
Create a Home Valuation Report for This Property
The Home Valuation Report is an in-depth analysis detailing your home's value as well as a comparison with similar homes in the area
Home Values in the Area
Average Home Value in this Area
Purchase History
| Date | Buyer | Sale Price | Title Company |
|---|---|---|---|
| Sim Chung Do Hyun | $1,310,000 | Chicago Title Company | |
| Forte Patrick J | -- | Placer Title Company | |
| Forte Patrick J | $495,000 | Financial Title Company |
Source: Public Records
Mortgage History
| Date | Status | Borrower | Loan Amount |
|---|---|---|---|
| Open | Sim Chung Do Hyun | $917,000 | |
| Previous Owner | Forte Patrick J | $228,000 | |
| Previous Owner | Forte Patrick J | $232,000 |
Source: Public Records
Tax History Compared to Growth
Tax History
| Year | Tax Paid | Tax Assessment Tax Assessment Total Assessment is a certain percentage of the fair market value that is determined by local assessors to be the total taxable value of land and additions on the property. | Land | Improvement |
|---|---|---|---|---|
| 2025 | $18,339 | $1,461,325 | $948,189 | $513,136 |
| 2024 | $18,048 | $1,432,673 | $929,598 | $503,075 |
| 2023 | $18,048 | $1,404,582 | $911,371 | $493,211 |
| 2022 | $17,844 | $1,377,042 | $893,501 | $483,541 |
| 2021 | $17,422 | $1,350,042 | $875,982 | $474,060 |
| 2019 | $9,944 | $681,869 | $378,894 | $302,975 |
| 2018 | $9,571 | $668,500 | $371,465 | $297,035 |
| 2017 | $9,219 | $655,393 | $364,182 | $291,211 |
| 2016 | $9,063 | $642,543 | $357,042 | $285,501 |
| 2015 | $8,916 | $632,892 | $351,679 | $281,213 |
| 2014 | $8,770 | $620,496 | $344,791 | $275,705 |
Source: Public Records
Map
Nearby Homes
- 2222 Dewberry Dr
- 490 Bollinger Canyon Ln Unit 367
- 460 Bollinger Canyon Ln Unit 286
- 221 Victory Cir
- 242 Eastridge Dr
- 408 Ustilago Ct
- 775 Watson Canyon Ct Unit 240
- 346 Eastridge Dr
- 332 Eastridge Dr Unit 66
- 1116 Vista Pointe Cir
- 805 Watson Canyon Ct Unit 163
- 162 Eastridge Dr Unit 185
- 164 Eastridge Dr
- 122 Eastridge Dr
- 115 Sapphire Ct
- 5436 Heatherland Dr
- 273 S Overlook Dr
- 6192 Lakeview Cir
- 6206 Lakeview Cir
- 205 Majorca Dr
- 213 Aspenwood Ct
- 221 Aspenwood Ct
- 209 Aspenwood Ct
- 225 Aspenwood Ct
- 112 Black Calla Ct
- 108 Black Calla Ct
- 116 Black Calla Ct
- 205 Aspenwood Ct
- 214 Aspenwood Ct
- 218 Aspenwood Ct
- 229 Aspenwood Ct
- 104 Black Calla Ct
- 222 Aspenwood Ct
- 210 Aspenwood Ct
- 120 Black Calla Ct
- 100 Black Calla Ct
- 206 Aspenwood Ct
- 201 Aspenwood Ct
- 233 Aspenwood Ct
- 202 Aspenwood Ct