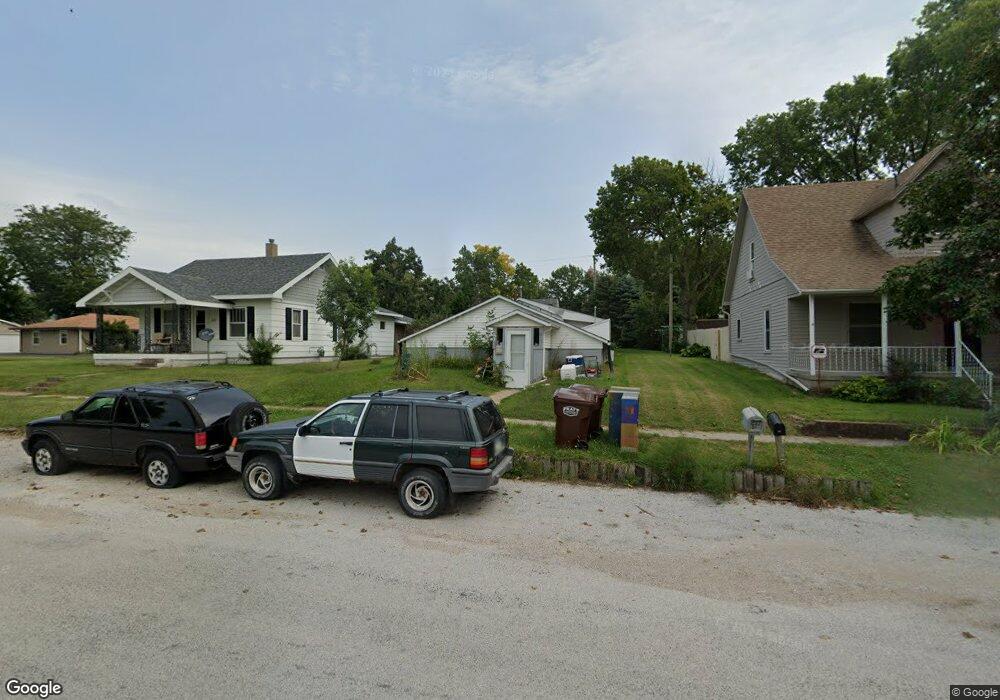
217 Baldwin St Maxwell, IA 50161
Estimated Value: $91,527 - $212,000
3
Beds
1
Bath
1,092
Sq Ft
$138/Sq Ft
Est. Value
About This Home
This home is located at 217 Baldwin St, Maxwell, IA 50161 and is currently estimated at $150,632, approximately $137 per square foot. 217 Baldwin St is a home with nearby schools including Collins-Maxwell Elementary School and Collins-Maxwell Middle/High School.
Ownership History
Date
Name
Owned For
Owner Type
Purchase Details
Closed on
Dec 30, 2024
Sold by
Pritchard Robert W and Pritchard Christine E
Bought by
Pritchard Real Estate Investments Llc
Current Estimated Value
Purchase Details
Closed on
Jul 28, 2006
Sold by
Hennick Dennis A
Bought by
Pritchard Robert W and Pritchard Christine E
Home Financials for this Owner
Home Financials are based on the most recent Mortgage that was taken out on this home.
Original Mortgage
$3,400
Interest Rate
6.83%
Mortgage Type
New Conventional
Create a Home Valuation Report for This Property
The Home Valuation Report is an in-depth analysis detailing your home's value as well as a comparison with similar homes in the area
Purchase History
| Date | Buyer | Sale Price | Title Company |
|---|---|---|---|
| Pritchard Real Estate Investments Llc | -- | None Listed On Document | |
| Pritchard Robert W | $45,000 | None Available |
Source: Public Records
Mortgage History
| Date | Status | Borrower | Loan Amount |
|---|---|---|---|
| Previous Owner | Pritchard Robert W | $3,400 | |
| Previous Owner | Pritchard Robert W | $36,000 |
Source: Public Records
Tax History
| Year | Tax Paid | Tax Assessment Tax Assessment Total Assessment is a certain percentage of the fair market value that is determined by local assessors to be the total taxable value of land and additions on the property. | Land | Improvement |
|---|---|---|---|---|
| 2025 | $1,146 | $70,400 | $18,800 | $51,600 |
| 2024 | $1,128 | $66,900 | $17,500 | $49,400 |
| 2023 | $1,158 | $66,900 | $17,500 | $49,400 |
| 2022 | $1,178 | $58,300 | $17,500 | $40,800 |
| 2021 | $1,092 | $58,300 | $17,500 | $40,800 |
| 2020 | $974 | $51,200 | $9,300 | $41,900 |
| 2019 | $974 | $51,200 | $9,300 | $41,900 |
| 2018 | $808 | $45,600 | $9,300 | $36,300 |
| 2017 | $808 | $45,600 | $9,300 | $36,300 |
| 2016 | $750 | $40,500 | $7,500 | $33,000 |
| 2015 | $750 | $40,500 | $7,500 | $33,000 |
| 2014 | $714 | $39,600 | $8,000 | $31,600 |
Source: Public Records
Map
Nearby Homes
Your Personal Tour Guide
Ask me questions while you tour the home.