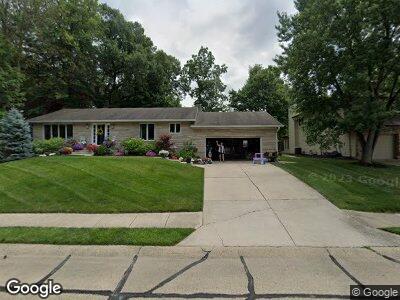
217 Cedar Hollow Ct West Lafayette, IN 47906
Estimated Value: $347,000 - $375,000
4
Beds
3
Baths
1,764
Sq Ft
$205/Sq Ft
Est. Value
About This Home
This home is located at 217 Cedar Hollow Ct, West Lafayette, IN 47906 and is currently estimated at $361,842, approximately $205 per square foot. 217 Cedar Hollow Ct is a home located in Tippecanoe County with nearby schools including Burnett Creek Elementary School, Battle Ground Middle School, and William Henry Harrison High School.
Ownership History
Date
Name
Owned For
Owner Type
Purchase Details
Closed on
Oct 26, 2009
Sold by
Federal National Mortgage Association
Bought by
Woolwine Marvin L and Woolwine Marissa L
Current Estimated Value
Home Financials for this Owner
Home Financials are based on the most recent Mortgage that was taken out on this home.
Original Mortgage
$137,750
Interest Rate
5.11%
Mortgage Type
New Conventional
Purchase Details
Closed on
Mar 13, 2009
Sold by
Ashman Theresa L
Bought by
Federal National Mortgage Association
Purchase Details
Closed on
May 10, 2006
Sold by
Ashman Douglas E
Bought by
Ashman Theresa L
Home Financials for this Owner
Home Financials are based on the most recent Mortgage that was taken out on this home.
Original Mortgage
$153,600
Interest Rate
6.68%
Mortgage Type
Unknown
Create a Home Valuation Report for This Property
The Home Valuation Report is an in-depth analysis detailing your home's value as well as a comparison with similar homes in the area
Home Values in the Area
Average Home Value in this Area
Purchase History
| Date | Buyer | Sale Price | Title Company |
|---|---|---|---|
| Woolwine Marvin L | -- | Statewide Title Company Inc | |
| Federal National Mortgage Association | $178,278 | None Available | |
| Ashman Theresa L | -- | None Available |
Source: Public Records
Mortgage History
| Date | Status | Borrower | Loan Amount |
|---|---|---|---|
| Open | Woolwine Marvin L | $125,000 | |
| Closed | Woolwine Marvin J | $23,200 | |
| Closed | Woolwine Marvin L | $185,600 | |
| Closed | Woolwine Marvin L | $110,000 | |
| Closed | Woolwine Marvin L | $97,500 | |
| Closed | Woolwine Marvin L | $28,000 | |
| Closed | Woolwine Marvin L | $14,600 | |
| Closed | Woolwine Marvin L | $136,000 | |
| Closed | Woolwine Marvin L | $137,750 | |
| Previous Owner | Ashman Theresa L | $38,400 | |
| Previous Owner | Ashman Theresa L | $153,600 |
Source: Public Records
Tax History Compared to Growth
Tax History
| Year | Tax Paid | Tax Assessment Tax Assessment Total Assessment is a certain percentage of the fair market value that is determined by local assessors to be the total taxable value of land and additions on the property. | Land | Improvement |
|---|---|---|---|---|
| 2024 | $2,462 | $251,900 | $50,400 | $201,500 |
| 2023 | $2,462 | $251,700 | $50,400 | $201,300 |
| 2022 | $2,217 | $222,100 | $50,400 | $171,700 |
| 2021 | $2,083 | $208,700 | $50,400 | $158,300 |
| 2020 | $2,083 | $208,700 | $50,400 | $158,300 |
| 2019 | $2,083 | $208,700 | $50,400 | $158,300 |
| 2018 | $2,009 | $200,800 | $38,000 | $162,800 |
| 2017 | $1,945 | $194,800 | $38,000 | $156,800 |
| 2016 | $1,809 | $189,300 | $38,000 | $151,300 |
| 2014 | $1,698 | $179,100 | $38,000 | $141,100 |
| 2013 | $1,707 | $174,800 | $38,100 | $136,700 |
Source: Public Records
Map
Nearby Homes
- 146 Westview Cir
- 200 Hamilton St
- 301 Overlook Dr
- 321 Overlook Dr
- 2520 N River Rd
- 3072 Hamilton St
- 625 Cumberland Ave
- 179 Villefranche Dr
- 124 Knox Dr
- 2843 Barlow St
- 142 Knox Dr
- 135 Knox Dr
- 2630 Clayton St
- 3208 Hamilton St
- 232 W Navajo St
- 139 E Navajo St
- 10 Steuben Ct
- 70 Steuben Ct
- 455 Lagrange St
- 704 Avondale St
- 217 Cedar Hollow Ct
- 213 Cedar Hollow Ct
- 213 Cedar Hollow Ct
- 221 Cedar Hollow Ct
- 216 Cedar Hollow Ct
- 209 Cedar Hollow Ct
- 424 Sharon Rd
- 210 Cedar Hollow Ct
- 2802 Soldiers Home Rd
- 220 Cedar Hollow Ct
- 2702 Soldiers Home Rd
- 206 Cedar Hollow Ct
- 205 Cedar Hollow Ct
- 225 Cedar Hollow Ct
- 418 Sharon Rd
- 500 Sharon Rd
- 2704 Soldiers Home Rd
- 224 Cedar Hollow Ct
- 412 Sharon Rd
- 200 Cedar Hollow Ct