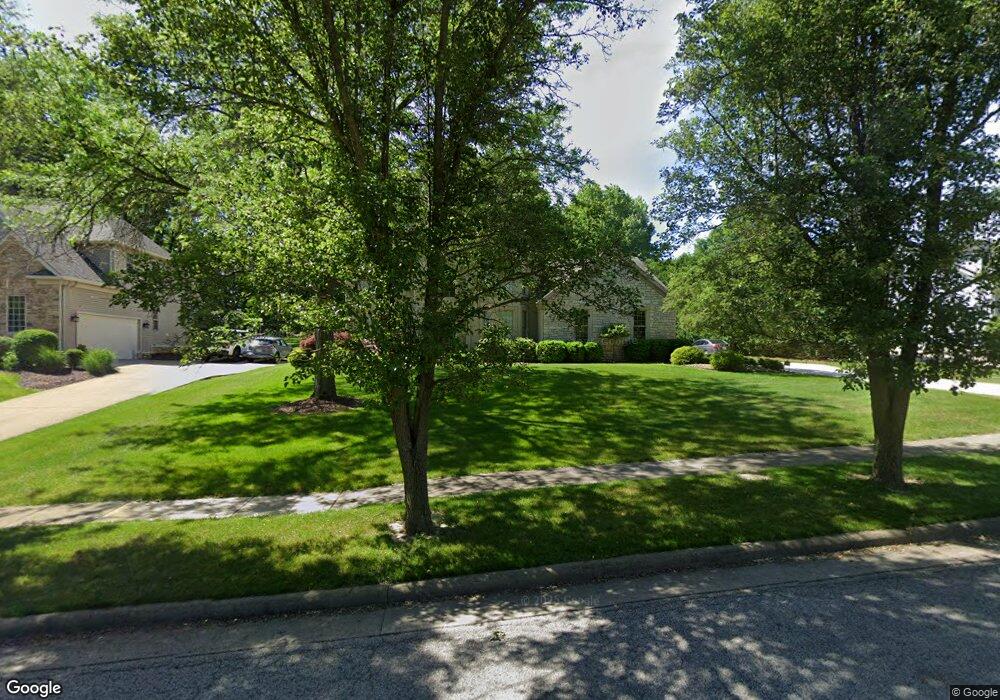
217 Colonial Dr Canfield, OH 44406
Estimated Value: $450,401 - $541,000
4
Beds
3
Baths
2,986
Sq Ft
$163/Sq Ft
Est. Value
About This Home
This home is located at 217 Colonial Dr, Canfield, OH 44406 and is currently estimated at $487,100, approximately $163 per square foot. 217 Colonial Dr is a home located in Mahoning County with nearby schools including Canfield Village Middle School and Canfield High School.
Ownership History
Date
Name
Owned For
Owner Type
Purchase Details
Closed on
Jul 29, 2002
Sold by
Prudential Relocation Inc
Bought by
Klempay John F and Klempay Karen J
Current Estimated Value
Home Financials for this Owner
Home Financials are based on the most recent Mortgage that was taken out on this home.
Original Mortgage
$105,000
Interest Rate
6.23%
Purchase Details
Closed on
Feb 9, 2002
Sold by
Niarmah Badger F and Badger Shelli M
Bought by
Prudential Relocation Inc
Purchase Details
Closed on
Jan 27, 1997
Sold by
Sudon Brothers Inc
Bought by
Badger Badger F and Badger Shelli M
Home Financials for this Owner
Home Financials are based on the most recent Mortgage that was taken out on this home.
Original Mortgage
$225,000
Interest Rate
5.75%
Mortgage Type
New Conventional
Purchase Details
Closed on
Sep 20, 1989
Bought by
Sudon Brothers Inc
Create a Home Valuation Report for This Property
The Home Valuation Report is an in-depth analysis detailing your home's value as well as a comparison with similar homes in the area
Home Values in the Area
Average Home Value in this Area
Purchase History
| Date | Buyer | Sale Price | Title Company |
|---|---|---|---|
| Klempay John F | $274,000 | -- | |
| Prudential Relocation Inc | $274,000 | -- | |
| Badger Badger F | $249,000 | -- | |
| Sudon Brothers Inc | -- | -- |
Source: Public Records
Mortgage History
| Date | Status | Borrower | Loan Amount |
|---|---|---|---|
| Closed | Klempay John F | $105,000 | |
| Previous Owner | Badger Badger F | $225,000 | |
| Closed | Klempay John F | $70,200 |
Source: Public Records
Tax History
| Year | Tax Paid | Tax Assessment Tax Assessment Total Assessment is a certain percentage of the fair market value that is determined by local assessors to be the total taxable value of land and additions on the property. | Land | Improvement |
|---|---|---|---|---|
| 2025 | $6,104 | $140,690 | $16,830 | $123,860 |
| 2024 | $6,106 | $140,690 | $16,830 | $123,860 |
| 2023 | $6,009 | $140,690 | $16,830 | $123,860 |
| 2022 | $5,568 | $103,660 | $16,830 | $86,830 |
| 2021 | $5,405 | $103,660 | $16,830 | $86,830 |
| 2020 | $5,682 | $103,660 | $16,830 | $86,830 |
| 2019 | $5,156 | $90,140 | $14,640 | $75,500 |
| 2018 | $5,690 | $90,140 | $14,640 | $75,500 |
| 2017 | $3,226 | $90,140 | $14,640 | $75,500 |
| 2016 | $4,722 | $85,180 | $14,640 | $70,540 |
| 2015 | $4,618 | $85,180 | $14,640 | $70,540 |
| 2014 | $4,637 | $85,180 | $14,640 | $70,540 |
| 2013 | $4,468 | $85,180 | $14,640 | $70,540 |
Source: Public Records
Map
Nearby Homes
- 30 Barnstone Ln Unit 18
- 223 Fairview Ave
- 120 Talsman Dr Unit 4
- 124 Wadsworth St
- 6916 S Raccoon Rd
- 71 Hilltop Blvd
- 181 Talsman Dr Unit B
- 36 Hilltop Blvd
- 361 Hilltop Blvd Unit 1A
- 264 W Main St
- 5025 Macy Ln
- 315 W Main St
- 5034 Macy Ln
- 6850 Abbey Rd N
- 6843 Abbey Rd
- 6580 Abbey Rd N
- 6060 S Raccoon Rd
- 7767 Exeter Ct
- 317 Verdant Ln
- 4300 Westford Place Unit 6C
- 225 Colonial Dr
- 209 Colonial Dr
- 115 Queens Ln
- 233 Colonial Dr
- 241 Colonial Dr
- 220 Colonial Dr
- 228 Colonial Dr
- 212 Colonial Dr
- 236 Colonial Dr
- 420 Janet Dr
- 204 Colonial Dr
- 430 Janet Dr
- 100 Queens Ln
- 135 Queens Ln
- 110 Queens Ln
- 244 Colonial Dr
- 440 Janet Dr
- 196 Colonial Dr
- 284 Colonial Dr
- 268 Colonial Dr
Your Personal Tour Guide
Ask me questions while you tour the home.