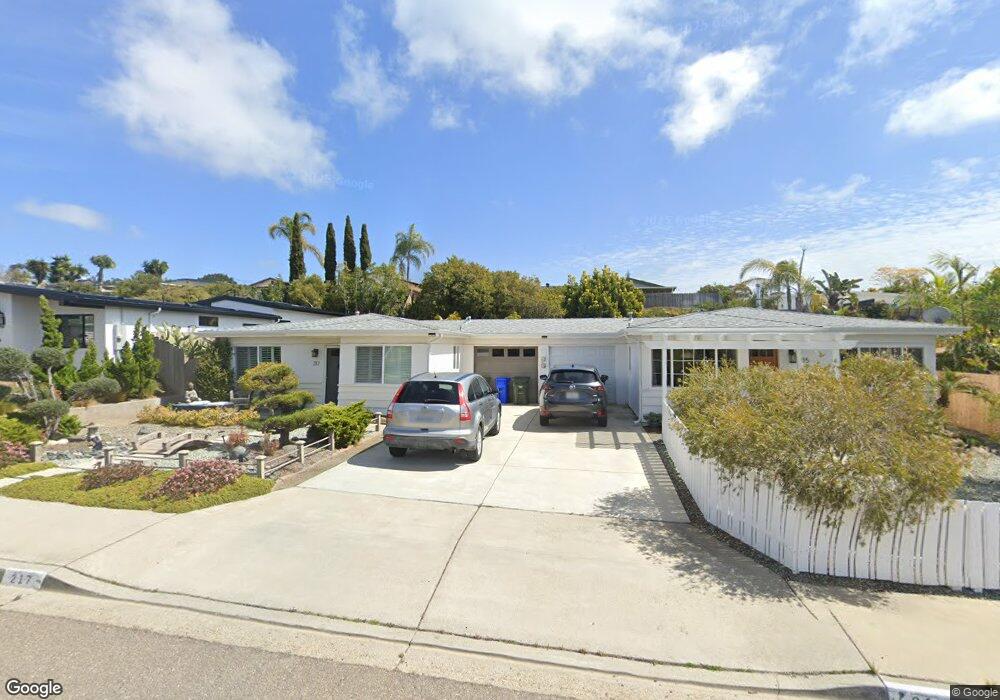
217 Delphinium St Encinitas, CA 92024
Central Encinitas NeighborhoodEstimated Value: $1,078,000 - $1,143,000
2
Beds
2
Baths
827
Sq Ft
$1,360/Sq Ft
Est. Value
About This Home
This home is located at 217 Delphinium St, Encinitas, CA 92024 and is currently estimated at $1,125,033, approximately $1,360 per square foot. 217 Delphinium St is a home located in San Diego County with nearby schools including Park Dale Lane Elementary, Oak Crest Middle School, and La Costa Canyon High School.
Ownership History
Date
Name
Owned For
Owner Type
Purchase Details
Closed on
Dec 15, 2011
Sold by
Hilton Susan
Bought by
Hilton Susan
Current Estimated Value
Home Financials for this Owner
Home Financials are based on the most recent Mortgage that was taken out on this home.
Original Mortgage
$276,000
Outstanding Balance
$187,879
Interest Rate
4.06%
Mortgage Type
New Conventional
Estimated Equity
$937,154
Purchase Details
Closed on
Oct 24, 2011
Sold by
Tsuenaka Tsutomu
Bought by
Hilton Susan
Home Financials for this Owner
Home Financials are based on the most recent Mortgage that was taken out on this home.
Original Mortgage
$276,000
Outstanding Balance
$187,879
Interest Rate
4.06%
Mortgage Type
New Conventional
Estimated Equity
$937,154
Purchase Details
Closed on
May 16, 1985
Bought by
Tsuenaka Tsutomu
Create a Home Valuation Report for This Property
The Home Valuation Report is an in-depth analysis detailing your home's value as well as a comparison with similar homes in the area
Home Values in the Area
Average Home Value in this Area
Purchase History
| Date | Buyer | Sale Price | Title Company |
|---|---|---|---|
| Hilton Susan | -- | None Available | |
| Hilton Susan | $345,000 | Stewart Title Company | |
| Tsuenaka Tsutomu | $69,500 | -- |
Source: Public Records
Mortgage History
| Date | Status | Borrower | Loan Amount |
|---|---|---|---|
| Open | Hilton Susan | $276,000 |
Source: Public Records
Tax History Compared to Growth
Tax History
| Year | Tax Paid | Tax Assessment Tax Assessment Total Assessment is a certain percentage of the fair market value that is determined by local assessors to be the total taxable value of land and additions on the property. | Land | Improvement |
|---|---|---|---|---|
| 2025 | $4,956 | $433,326 | $351,689 | $81,637 |
| 2024 | $4,956 | $424,831 | $344,794 | $80,037 |
| 2023 | $4,800 | $416,502 | $338,034 | $78,468 |
| 2022 | $4,635 | $408,336 | $331,406 | $76,930 |
| 2021 | $4,614 | $400,330 | $324,908 | $75,422 |
| 2020 | $4,597 | $396,226 | $321,577 | $74,649 |
| 2019 | $4,509 | $388,458 | $315,272 | $73,186 |
| 2018 | $4,392 | $380,842 | $309,091 | $71,751 |
| 2017 | $191 | $373,376 | $303,031 | $70,345 |
| 2016 | $4,117 | $366,056 | $297,090 | $68,966 |
| 2015 | $4,012 | $360,559 | $292,628 | $67,931 |
| 2014 | $3,928 | $353,497 | $286,896 | $66,601 |
Source: Public Records
Map
Nearby Homes
- 0 Mays Hollow Ln
- 557 Samuel Ct
- 508 Hidden Ridge Ct
- 571 Lynwood Dr
- 407 Via Ultimo
- 623 Quail Gardens Ln
- 656 Westlake St
- 444 N El Camino Real Unit 47
- 444 N El Camino Real Unit SPC 42
- 444 N El Camino Real Unit 119
- 213 Via Palacio
- 760 Bonita Dr
- 722 Piedras Oro Calle Unit 6
- 350 N El Camino Real Unit 50
- 350 N El Camino Real Unit 72
- 836 Jensen Ct
- 394 Carmel Creeper Place
- 1015 Gardena Rd
- 1403 Anacona Place Unit 103
- 1400 Anacona Place Unit 105
- 215 Delphinium St
- 209 Delphinium St
- 211 Delphinium St
- 221 Delphinium St
- 223 Delphinium St
- 218 Gloxina St
- 212 Gloxina St
- 214 Gloxina St
- 212 Gloxina St
- 224 Gloxina St
- 226 Gloxina St
- 214 Delphinium St
- 216 Delphinium St
- 203 Delphinium St
- 205 Delphinium St
- 229 Delphinium St
- 227 Delphinium St
- 220 Delphinium St
- 222 Delphinium St
- 208 Delphinium St