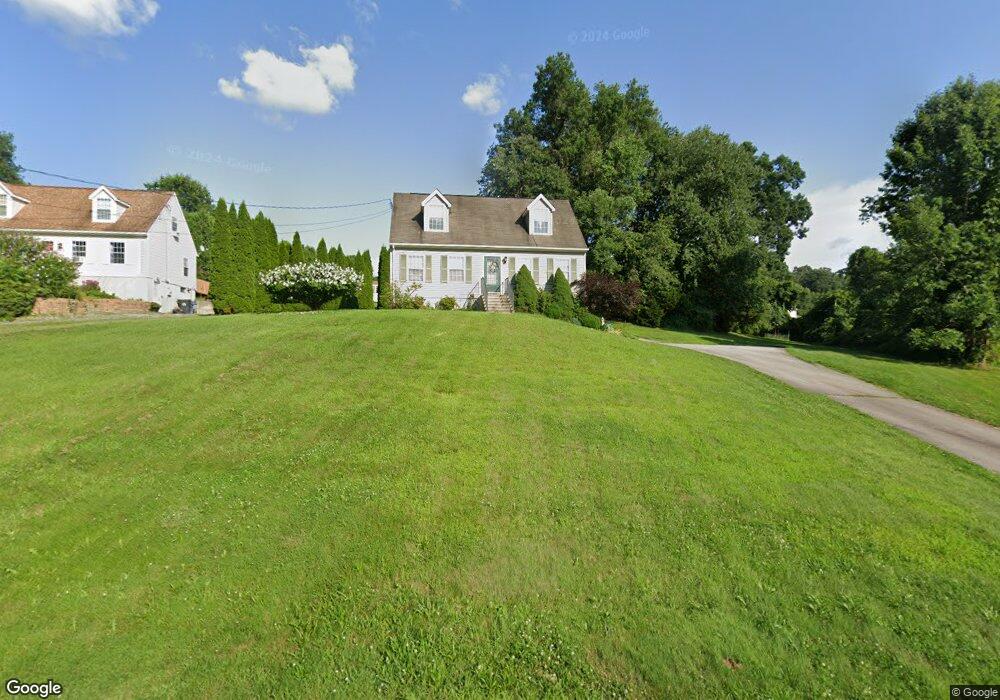
217 Dow Rd Plainfield, CT 06374
Estimated Value: $323,000 - $358,000
4
Beds
6
Baths
1,339
Sq Ft
$257/Sq Ft
Est. Value
About This Home
This home is located at 217 Dow Rd, Plainfield, CT 06374 and is currently estimated at $344,433, approximately $257 per square foot. 217 Dow Rd is a home located in Windham County with nearby schools including Plainfield Memorial School, Plainfield Central Middle School, and Plainfield High School.
Ownership History
Date
Name
Owned For
Owner Type
Purchase Details
Closed on
Oct 9, 2009
Sold by
Res Funding Corp
Bought by
Coletti Malgorzata
Current Estimated Value
Home Financials for this Owner
Home Financials are based on the most recent Mortgage that was taken out on this home.
Original Mortgage
$10,750
Outstanding Balance
$7,013
Interest Rate
5.14%
Estimated Equity
$337,420
Purchase Details
Closed on
Jun 22, 2009
Sold by
Benfatto Richard
Bought by
Residential Fndg Co Ll
Purchase Details
Closed on
Dec 28, 2006
Sold by
Martell Thomas C and Martell Corinne M
Bought by
Benfatto Mark and Benfatto Richard
Purchase Details
Closed on
Feb 25, 2000
Sold by
Dow Rd Assoc Inc
Bought by
Martell Thomas C and Higgins Corinne M
Create a Home Valuation Report for This Property
The Home Valuation Report is an in-depth analysis detailing your home's value as well as a comparison with similar homes in the area
Home Values in the Area
Average Home Value in this Area
Purchase History
| Date | Buyer | Sale Price | Title Company |
|---|---|---|---|
| Coletti Malgorzata | $160,000 | -- | |
| Coletti Malgorzata | $160,000 | -- | |
| Residential Fndg Co Ll | -- | -- | |
| Residential Fndg Co Ll | -- | -- | |
| Benfatto Mark | $227,500 | -- | |
| Benfatto Mark | $227,500 | -- | |
| Martell Thomas C | $108,500 | -- | |
| Martell Thomas C | $108,500 | -- |
Source: Public Records
Mortgage History
| Date | Status | Borrower | Loan Amount |
|---|---|---|---|
| Open | Martell Thomas C | $10,750 | |
| Open | Martell Thomas C | $157,100 |
Source: Public Records
Tax History
| Year | Tax Paid | Tax Assessment Tax Assessment Total Assessment is a certain percentage of the fair market value that is determined by local assessors to be the total taxable value of land and additions on the property. | Land | Improvement |
|---|---|---|---|---|
| 2025 | $4,207 | $181,040 | $32,900 | $148,140 |
| 2024 | $4,043 | $181,040 | $32,900 | $148,140 |
| 2023 | $4,023 | $181,040 | $32,900 | $148,140 |
| 2022 | $5,687 | $117,580 | $34,430 | $83,150 |
| 2021 | $3,543 | $117,580 | $34,430 | $83,150 |
| 2020 | $3,531 | $117,580 | $34,430 | $83,150 |
| 2019 | $3,531 | $117,580 | $34,430 | $83,150 |
| 2018 | $3,487 | $117,580 | $34,430 | $83,150 |
| 2017 | $3,367 | $106,490 | $29,940 | $76,550 |
| 2016 | $3,248 | $106,490 | $29,940 | $76,550 |
| 2015 | $3,174 | $106,490 | $29,940 | $76,550 |
| 2014 | $3,174 | $106,490 | $29,940 | $76,550 |
Source: Public Records
Map
Nearby Homes
- 0 West Pkwy
- 0 Dow Rd Unit 24128109
- 0 Pond St Unit 24037041
- 36 Plainfield Pike
- 0A Norwich Rd
- 00 Norwich Rd
- 75 Academy Hill Rd
- 33 Railroad Ave
- 11 Brookside
- 46-48 Pleasant St
- 34 Pleasant St Unit 6
- 34 Pleasant St Unit 4
- 34 Pleasant St Unit 3
- 34 Pleasant St Unit 7
- 34 Pleasant St Unit 8
- 34 Pleasant St Unit 5
- 83 Kate Downing Rd
- 40 Tarbox Rd
- 41-45 Grove St
- 383 Lathrop Rd
Your Personal Tour Guide
Ask me questions while you tour the home.