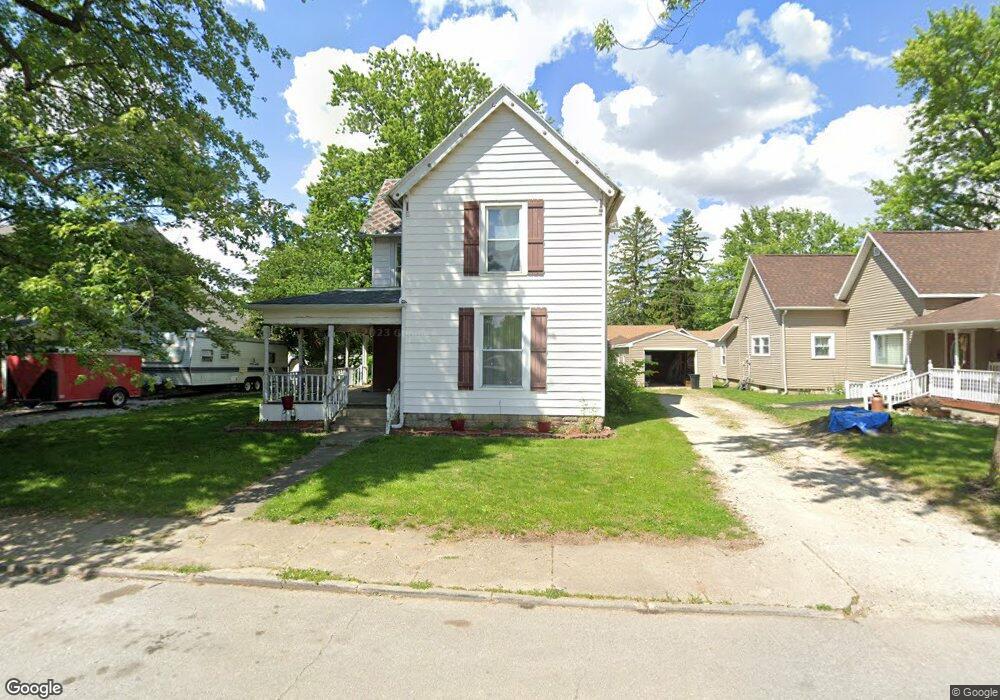
217 E 3rd St Warren, IN 46792
Estimated Value: $141,000 - $174,000
4
Beds
1
Bath
2,268
Sq Ft
$69/Sq Ft
Est. Value
About This Home
This home is located at 217 E 3rd St, Warren, IN 46792 and is currently estimated at $157,240, approximately $69 per square foot. 217 E 3rd St is a home located in Huntington County with nearby schools including Salamonie School and Huntington North High School.
Ownership History
Date
Name
Owned For
Owner Type
Purchase Details
Closed on
May 5, 2009
Sold by
Citibank N A
Bought by
Arbuckle Brad A and Arbuckle Albert
Current Estimated Value
Purchase Details
Closed on
Oct 28, 2008
Sold by
Farthing Sheriff Kent R
Bought by
Schickel Attorney Leslie W
Purchase Details
Closed on
Dec 19, 2005
Sold by
Fiffen Becky J and Arnett Becky J
Bought by
Fippen Richard and Fippen Becky J
Home Financials for this Owner
Home Financials are based on the most recent Mortgage that was taken out on this home.
Original Mortgage
$54,000
Interest Rate
8.81%
Mortgage Type
Adjustable Rate Mortgage/ARM
Create a Home Valuation Report for This Property
The Home Valuation Report is an in-depth analysis detailing your home's value as well as a comparison with similar homes in the area
Purchase History
| Date | Buyer | Sale Price | Title Company |
|---|---|---|---|
| Arbuckle Brad A | $14,285 | -- | |
| Arbuckle Brad | -- | None Available | |
| Schickel Attorney Leslie W | $40,950 | Feiwell & Hannoy | |
| Citibank Na | $40,950 | None Available | |
| Fippen Richard | -- | None Available |
Source: Public Records
Mortgage History
| Date | Status | Borrower | Loan Amount |
|---|---|---|---|
| Previous Owner | Fippen Richard | $54,000 |
Source: Public Records
Tax History
| Year | Tax Paid | Tax Assessment Tax Assessment Total Assessment is a certain percentage of the fair market value that is determined by local assessors to be the total taxable value of land and additions on the property. | Land | Improvement |
|---|---|---|---|---|
| 2024 | $1,114 | $120,000 | $9,800 | $110,200 |
| 2023 | $839 | $100,700 | $9,800 | $90,900 |
| 2022 | $772 | $90,800 | $9,800 | $81,000 |
| 2021 | $702 | $83,700 | $9,800 | $73,900 |
| 2020 | $784 | $87,300 | $9,800 | $77,500 |
| 2019 | $533 | $75,300 | $9,800 | $65,500 |
| 2018 | $525 | $71,700 | $9,800 | $61,900 |
| 2017 | $487 | $71,300 | $9,800 | $61,500 |
| 2016 | $413 | $70,700 | $9,800 | $60,900 |
| 2014 | $331 | $57,000 | $9,800 | $47,200 |
| 2013 | $331 | $55,200 | $9,800 | $45,400 |
Source: Public Records
Map
Nearby Homes
- 412 N Nancy St
- 123 W 1st St
- 212 N Hendricks St
- 203 E 8th St
- 619 E 6th St
- 11899 S Hartford City Rd
- I 69 E 700 N
- 9964 E 400 N
- 201 E Vine St
- 8539 W 1000 S-90
- 603 W Main St
- 6420 S 400 W
- 8885 E 400 N
- 2384 S 400 W
- 11757 E 1000 S-27
- 2804 N 800 E
- 6213 S 594 W
- 4015 N 600 E
- 0183 W State Road 18
- 9814 S Cr 200 W
Your Personal Tour Guide
Ask me questions while you tour the home.