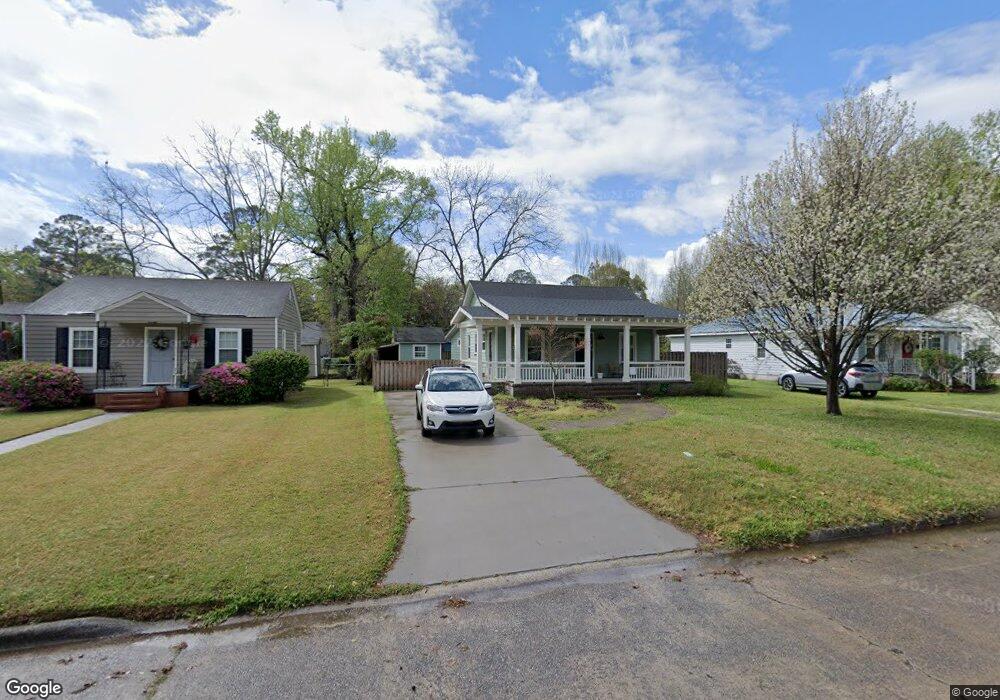
217 E 58th St Savannah, GA 31405
Ardmore-Gould Estates-Olin Heights NeighborhoodEstimated Value: $242,421 - $307,000
3
Beds
2
Baths
1,431
Sq Ft
$187/Sq Ft
Est. Value
About This Home
This home is located at 217 E 58th St, Savannah, GA 31405 and is currently estimated at $267,605, approximately $187 per square foot. 217 E 58th St is a home located in Chatham County with nearby schools including Jacob G. Smith Elementary School, Myers Middle School, and Beach High School.
Ownership History
Date
Name
Owned For
Owner Type
Purchase Details
Closed on
May 11, 2016
Sold by
Nvision Capital Advisors Llc
Bought by
Douglas Lakyshia
Current Estimated Value
Purchase Details
Closed on
Jun 19, 2015
Sold by
Hometown Community Develop
Bought by
Nvision Capital Advisors Llc
Purchase Details
Closed on
Aug 19, 2014
Sold by
The Coastal Empire Habitat For
Bought by
Hometown Community Development
Purchase Details
Closed on
Feb 28, 2013
Sold by
Us Bank National Associati
Bought by
Coastal Empire Habitat For Hum
Purchase Details
Closed on
Oct 2, 2012
Sold by
Raines Eisenhower
Bought by
Us Bank National Association T
Create a Home Valuation Report for This Property
The Home Valuation Report is an in-depth analysis detailing your home's value as well as a comparison with similar homes in the area
Home Values in the Area
Average Home Value in this Area
Purchase History
| Date | Buyer | Sale Price | Title Company |
|---|---|---|---|
| Douglas Lakyshia | $37,000 | -- | |
| Nvision Capital Advisors Llc | $50,700 | -- | |
| Hometown Community Development | $5,204 | -- | |
| Coastal Empire Habitat For Hum | -- | -- | |
| Us Bank National Association T | -- | -- |
Source: Public Records
Tax History
| Year | Tax Paid | Tax Assessment Tax Assessment Total Assessment is a certain percentage of the fair market value that is determined by local assessors to be the total taxable value of land and additions on the property. | Land | Improvement |
|---|---|---|---|---|
| 2025 | $1,440 | $76,760 | $7,920 | $68,840 |
| 2024 | $5 | $86,160 | $7,920 | $78,240 |
| 2023 | $363 | $72,200 | $7,920 | $64,280 |
| 2022 | $668 | $42,120 | $4,800 | $37,320 |
| 2021 | $1,357 | $35,840 | $3,840 | $32,000 |
| 2020 | $878 | $27,800 | $2,040 | $25,760 |
| 2019 | $1,601 | $27,800 | $2,040 | $25,760 |
| 2018 | $798 | $23,200 | $2,040 | $21,160 |
| 2017 | $714 | $24,360 | $2,920 | $21,440 |
| 2016 | $491 | $16,840 | $2,920 | $13,920 |
| 2015 | $736 | $17,640 | $2,920 | $14,720 |
| 2014 | $759 | $23,200 | $0 | $0 |
Source: Public Records
Map
Nearby Homes
Your Personal Tour Guide
Ask me questions while you tour the home.