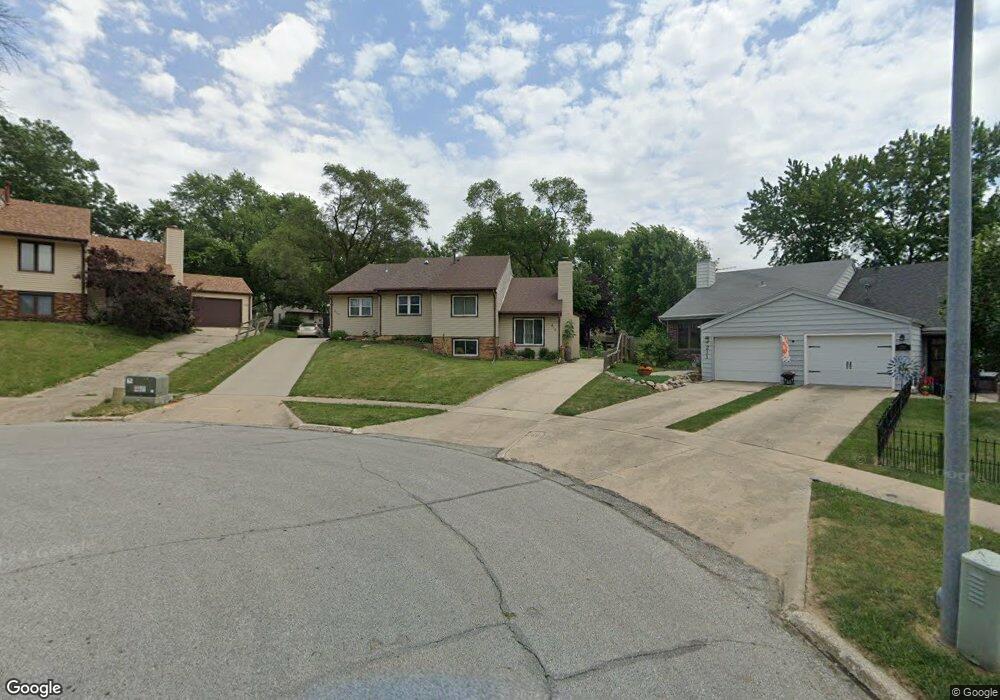
217 E Hughes Cir Des Moines, IA 50315
Indianola Hills NeighborhoodEstimated Value: $168,000 - $208,000
2
Beds
1
Bath
1,056
Sq Ft
$178/Sq Ft
Est. Value
About This Home
This home is located at 217 E Hughes Cir, Des Moines, IA 50315 and is currently estimated at $188,208, approximately $178 per square foot. 217 E Hughes Cir is a home located in Polk County with nearby schools including Howe Elementary School, Weeks Middle School, and Lincoln High School.
Ownership History
Date
Name
Owned For
Owner Type
Purchase Details
Closed on
Sep 2, 2025
Sold by
Cline Julie A
Bought by
Julie A Cline Revocable Trust and Cline
Current Estimated Value
Purchase Details
Closed on
Mar 22, 2007
Sold by
Schumacher Larry A
Bought by
Cline Julie A
Home Financials for this Owner
Home Financials are based on the most recent Mortgage that was taken out on this home.
Original Mortgage
$78,000
Interest Rate
6.31%
Mortgage Type
Purchase Money Mortgage
Purchase Details
Closed on
May 10, 2005
Sold by
May Jeremy S and May Amber S
Bought by
Cline Julie A and Schumacher Larry A
Home Financials for this Owner
Home Financials are based on the most recent Mortgage that was taken out on this home.
Original Mortgage
$65,600
Interest Rate
5.82%
Mortgage Type
Fannie Mae Freddie Mac
Purchase Details
Closed on
Apr 18, 2001
Sold by
Deal Donald W and Deal Dawn M
Bought by
May Jeremy S and May Amber S
Home Financials for this Owner
Home Financials are based on the most recent Mortgage that was taken out on this home.
Original Mortgage
$78,271
Interest Rate
7.03%
Mortgage Type
FHA
Create a Home Valuation Report for This Property
The Home Valuation Report is an in-depth analysis detailing your home's value as well as a comparison with similar homes in the area
Home Values in the Area
Average Home Value in this Area
Purchase History
| Date | Buyer | Sale Price | Title Company |
|---|---|---|---|
| Julie A Cline Revocable Trust | -- | None Listed On Document | |
| Cline Julie A | -- | Itc | |
| Cline Julie A | $81,500 | -- | |
| May Jeremy S | $79,000 | -- |
Source: Public Records
Mortgage History
| Date | Status | Borrower | Loan Amount |
|---|---|---|---|
| Previous Owner | Cline Julie A | $78,000 | |
| Previous Owner | Cline Julie A | $65,600 | |
| Previous Owner | May Jeremy S | $78,271 |
Source: Public Records
Tax History Compared to Growth
Tax History
| Year | Tax Paid | Tax Assessment Tax Assessment Total Assessment is a certain percentage of the fair market value that is determined by local assessors to be the total taxable value of land and additions on the property. | Land | Improvement |
|---|---|---|---|---|
| 2025 | $2,276 | $146,500 | $32,500 | $114,000 |
| 2024 | $2,276 | $133,200 | $29,000 | $104,200 |
| 2023 | $2,650 | $133,200 | $29,000 | $104,200 |
| 2022 | $2,628 | $112,400 | $25,000 | $87,400 |
| 2021 | $2,480 | $112,400 | $25,000 | $87,400 |
| 2020 | $2,576 | $99,400 | $22,300 | $77,100 |
| 2019 | $2,346 | $99,400 | $22,300 | $77,100 |
| 2018 | $2,322 | $87,300 | $19,100 | $68,200 |
| 2017 | $2,190 | $87,300 | $19,100 | $68,200 |
| 2016 | $2,134 | $81,000 | $17,500 | $63,500 |
| 2015 | $2,134 | $81,000 | $17,500 | $63,500 |
| 2014 | $2,144 | $83,700 | $17,600 | $66,100 |
Source: Public Records
Map
Nearby Homes
- 206 E Hughes Cir
- 217 E Park Ave
- 119 E Park Ave
- 309 E Park Ave
- 3508 Fairlane Dr
- 314 E Park Ave
- 3303 SE 4th St
- 3314 S Union St
- 3224 SW 2nd St
- 3503 SW 2nd St
- 117 E Rose Ave
- 300 Hughes Ave
- 118 E Watrous Ave
- 323 E Broad St
- 342 E Pleasant View Dr
- 220 Virginia Ave
- 3822 SW 2nd St
- 303 Virginia Ave
- 3634 SW 4th St
- 608 E Virginia Ave
- 215 E Hughes Cir
- 220 E Hughes Cir
- 211 E Hughes Cir
- 218 E Hughes Cir
- 3306 SE 3rd St
- 209 E Hughes Cir
- 3300 SE 3rd St
- 3312 SE 3rd St
- 3232 SE 3rd St
- 205 E Hughes Cir
- 204 E Caulder Cir
- 214 E Hughes Cir
- 210 E Caulder Cir
- 3320 SE 3rd St
- 3216 SE 3rd St
- 212 E Hughes Cir
- 200 E Caulder Cir
- 3400 SE 3rd St
- 3208 SE 3rd St
- 3307 SE 1st St