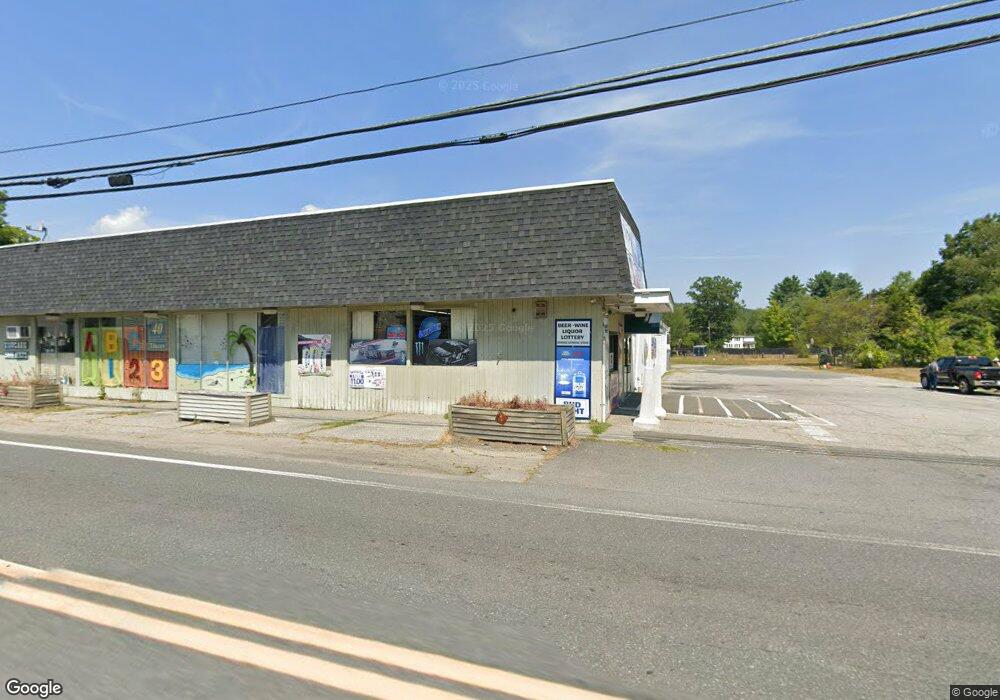
217 E Main St Orange, MA 01364
Estimated Value: $869,585
Studio
2
Baths
1,700
Sq Ft
$512/Sq Ft
Est. Value
About This Home
This home is located at 217 E Main St, Orange, MA 01364 and is currently estimated at $869,585, approximately $511 per square foot. 217 E Main St is a home located in Franklin County with nearby schools including Fisher Hill and Ralph C Mahar Regional School.
Ownership History
Date
Name
Owned For
Owner Type
Purchase Details
Closed on
Jul 11, 2018
Sold by
Orange Main Street T and Patel
Bought by
Orange East Main Stree and Patel
Current Estimated Value
Home Financials for this Owner
Home Financials are based on the most recent Mortgage that was taken out on this home.
Original Mortgage
$340,000
Outstanding Balance
$292,176
Interest Rate
4.5%
Mortgage Type
New Conventional
Estimated Equity
$577,409
Purchase Details
Closed on
Jan 29, 2009
Sold by
Donelans Supermarket I
Bought by
Patel Tr Jignesh N and Patel Kamini
Home Financials for this Owner
Home Financials are based on the most recent Mortgage that was taken out on this home.
Original Mortgage
$70,124
Interest Rate
5.28%
Mortgage Type
Commercial
Purchase Details
Closed on
Oct 2, 2008
Sold by
Donelans Realty Inc
Bought by
Donelans Super Market
Create a Home Valuation Report for This Property
The Home Valuation Report is an in-depth analysis detailing your home's value as well as a comparison with similar homes in the area
Home Values in the Area
Average Home Value in this Area
Purchase History
| Date | Buyer | Sale Price | Title Company |
|---|---|---|---|
| Orange East Main Stree | $425,000 | -- | |
| Patel Tr Jignesh N | $390,000 | -- | |
| Donelans Super Market | -- | -- |
Source: Public Records
Mortgage History
| Date | Status | Borrower | Loan Amount |
|---|---|---|---|
| Open | Orange East Main Stree | $340,000 | |
| Previous Owner | Patel Tr Jignesh N | $70,124 | |
| Previous Owner | Patel Tr Jignesh N | $312,000 |
Source: Public Records
Tax History
| Year | Tax Paid | Tax Assessment Tax Assessment Total Assessment is a certain percentage of the fair market value that is determined by local assessors to be the total taxable value of land and additions on the property. | Land | Improvement |
|---|---|---|---|---|
| 2025 | $131 | $796,000 | $83,900 | $712,100 |
| 2024 | $16,073 | $921,600 | $83,900 | $837,700 |
| 2023 | $19,338 | $1,076,700 | $83,900 | $992,800 |
| 2022 | $11,476 | $600,200 | $83,900 | $516,300 |
| 2021 | $8,798 | $438,800 | $87,500 | $351,300 |
| 2020 | $8,679 | $426,900 | $84,100 | $342,800 |
| 2019 | $8,751 | $388,600 | $75,200 | $313,400 |
| 2018 | $8,271 | $377,000 | $71,900 | $305,100 |
| 2017 | $8,558 | $403,100 | $71,900 | $331,200 |
| 2016 | $9,125 | $420,500 | $55,500 | $365,000 |
| 2015 | $8,962 | $431,500 | $55,500 | $376,000 |
| 2014 | $8,536 | $432,400 | $55,500 | $376,900 |
Source: Public Records
Map
Nearby Homes
Your Personal Tour Guide
Ask me questions while you tour the home.