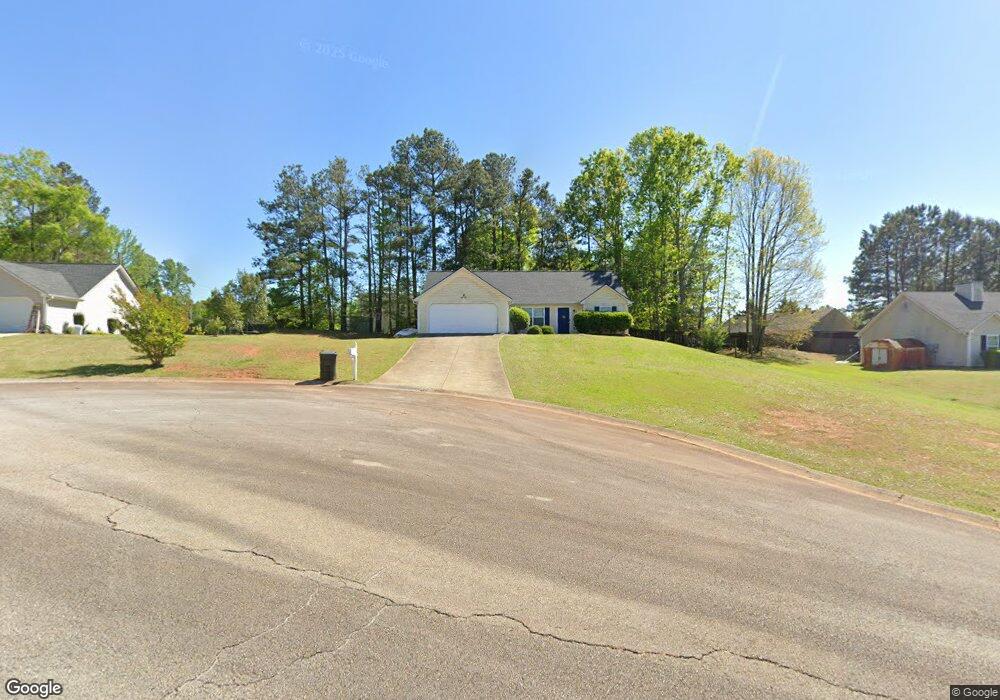
217 Jordan Ln Carrollton, GA 30116
Abilene NeighborhoodEstimated Value: $240,000 - $252,000
3
Beds
2
Baths
1,270
Sq Ft
$193/Sq Ft
Est. Value
About This Home
This home is located at 217 Jordan Ln, Carrollton, GA 30116 and is currently estimated at $245,627, approximately $193 per square foot. 217 Jordan Ln is a home located in Carroll County with nearby schools including Sand Hill Elementary School, Bay Springs Middle School, and Villa Rica High School.
Ownership History
Date
Name
Owned For
Owner Type
Purchase Details
Closed on
Jun 14, 2019
Sold by
Hart George Marvin
Bought by
Brasher Adam and Brasher Cindy
Current Estimated Value
Home Financials for this Owner
Home Financials are based on the most recent Mortgage that was taken out on this home.
Original Mortgage
$133,438
Outstanding Balance
$120,401
Interest Rate
5.5%
Mortgage Type
FHA
Estimated Equity
$125,226
Purchase Details
Closed on
May 21, 2015
Sold by
Favors Eric J
Bought by
Hart George Marvin
Purchase Details
Closed on
Dec 28, 2009
Sold by
Secretary Of Housing
Bought by
Favors Eric J
Purchase Details
Closed on
Apr 7, 2009
Sold by
Wells Fargo Bank Na
Bought by
Secretary Of Housing
Purchase Details
Closed on
Dec 29, 2004
Sold by
Rdc Builders Inc
Bought by
Ryan Robert J and Ryan Jennifer N
Purchase Details
Closed on
Dec 11, 2003
Sold by
R Development Company
Bought by
Rdc Builders Inc
Purchase Details
Closed on
Oct 13, 2003
Bought by
R Development Company
Create a Home Valuation Report for This Property
The Home Valuation Report is an in-depth analysis detailing your home's value as well as a comparison with similar homes in the area
Home Values in the Area
Average Home Value in this Area
Purchase History
| Date | Buyer | Sale Price | Title Company |
|---|---|---|---|
| Brasher Adam | $135,900 | -- | |
| Hart George Marvin | $15,000 | -- | |
| Favors Eric J | $50,000 | -- | |
| Secretary Of Housing | $109,472 | -- | |
| Wells Fargo Bank Na | $109,472 | -- | |
| Ryan Robert J | $106,300 | -- | |
| Ryan Robert J | $106,288 | -- | |
| Rdc Builders Inc | $518,000 | -- | |
| R Development Company | -- | -- |
Source: Public Records
Mortgage History
| Date | Status | Borrower | Loan Amount |
|---|---|---|---|
| Open | Brasher Adam | $133,438 |
Source: Public Records
Tax History Compared to Growth
Tax History
| Year | Tax Paid | Tax Assessment Tax Assessment Total Assessment is a certain percentage of the fair market value that is determined by local assessors to be the total taxable value of land and additions on the property. | Land | Improvement |
|---|---|---|---|---|
| 2024 | $2,160 | $93,706 | $6,000 | $87,706 |
| 2023 | $2,160 | $85,720 | $6,000 | $79,720 |
| 2022 | $1,795 | $69,983 | $6,000 | $63,983 |
| 2021 | $1,600 | $60,844 | $6,000 | $54,844 |
| 2020 | $1,434 | $54,309 | $6,000 | $48,309 |
| 2019 | $1,241 | $46,424 | $6,000 | $40,424 |
| 2018 | $989 | $36,146 | $4,800 | $31,346 |
| 2017 | $992 | $36,146 | $4,800 | $31,346 |
| 2016 | $1,097 | $40,116 | $6,400 | $33,716 |
| 2015 | $731 | $28,706 | $8,000 | $20,706 |
| 2014 | -- | $28,706 | $8,000 | $20,706 |
Source: Public Records
Map
Nearby Homes
- 22 Shell Rd
- 377 Dock Hyde Rd
- 436 Laurel Trace
- 315 Terrace Ridge
- 79 Oak Wood Dr
- 509 Tree Ridge Dr
- 0 Dock Hyde Rd Unit 10627769
- 10 Amberly Way
- 55 Sage Hill Dr
- 65 Lake Connie Rd
- 136 Jennifer Ln
- 0 Frashier Rd Unit 7549781
- 0 Frashier Rd Unit 10488685
- 184 Lake Connie Rd
- 125 Sweet Bay Ln
- 70 E Honeysuckle Ln
- 133 Deerfield Ln
- 201 Deerfield Ln
- 10 Deerfield Ln
- 119 Muscadine Way
- 308 Christian Ln
- 213 Jordan Ln
- 221 Jordan Ln
- 140 Mccoy Dr
- 312 Christian Ln
- 224 Jordan Ln
- 145 Mccoy Dr
- 220 Jordan Ln
- 130 Mccoy Dr
- 135 Mccoy Dr
- 0 Christian Ln Unit 7478749
- 0 Christian Ln Unit 7464703
- 0 Christian Ln Unit 7375772
- 0 Christian Ln Unit 7222050
- 0 Christian Ln Unit 3127523
- 0 Christian Ln Unit 8055535
- 0 Christian Ln Unit 7591553
- 0 Christian Ln Unit 3279607
- 0 Christian Ln Unit 7596041
- 0 Christian Ln Unit 7171033