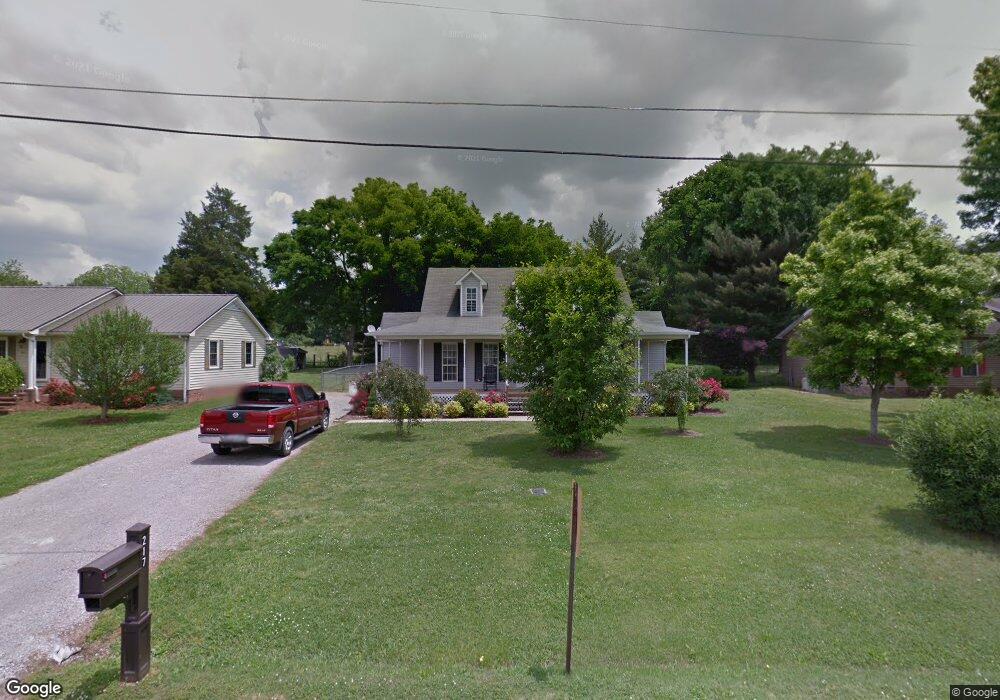
217 Keenan Ln Shelbyville, TN 37160
Estimated Value: $270,623 - $331,000
--
Bed
2
Baths
1,570
Sq Ft
$200/Sq Ft
Est. Value
About This Home
This home is located at 217 Keenan Ln, Shelbyville, TN 37160 and is currently estimated at $314,156, approximately $200 per square foot. 217 Keenan Ln is a home located in Bedford County with nearby schools including South Side Elementary School, Harris Middle School, and Christian Chapel Academy.
Ownership History
Date
Name
Owned For
Owner Type
Purchase Details
Closed on
May 24, 2023
Sold by
Carlton Janice
Bought by
Carlton Janice
Current Estimated Value
Purchase Details
Closed on
Apr 30, 2015
Sold by
Hernandez Demetrio P
Bought by
Carlton Janice
Purchase Details
Closed on
Nov 22, 1999
Sold by
Hernandez Demetrio P and Hernandez Ang
Bought by
Hernandez Pemetrio P
Purchase Details
Closed on
Nov 13, 1998
Sold by
Hathcock Tracy Lynne
Bought by
Hernandez Demetrio P and Hernandez Ang
Home Financials for this Owner
Home Financials are based on the most recent Mortgage that was taken out on this home.
Original Mortgage
$85,690
Interest Rate
6.47%
Purchase Details
Closed on
Sep 19, 1995
Sold by
Butts Jay B
Bought by
Hathcock Tracy L
Purchase Details
Closed on
Sep 3, 1987
Bought by
Butts Jay B & Bonnie A
Create a Home Valuation Report for This Property
The Home Valuation Report is an in-depth analysis detailing your home's value as well as a comparison with similar homes in the area
Home Values in the Area
Average Home Value in this Area
Purchase History
| Date | Buyer | Sale Price | Title Company |
|---|---|---|---|
| Carlton Janice | $50,000 | None Listed On Document | |
| Carlton Janice | $125,000 | -- | |
| Hernandez Pemetrio P | -- | -- | |
| Hernandez Demetrio P | $90,200 | -- | |
| Hathcock Tracy L | $69,500 | -- | |
| Butts Jay B & Bonnie A | $60,000 | -- |
Source: Public Records
Mortgage History
| Date | Status | Borrower | Loan Amount |
|---|---|---|---|
| Previous Owner | Butts Jay B & Bonnie A | $85,690 |
Source: Public Records
Tax History Compared to Growth
Tax History
| Year | Tax Paid | Tax Assessment Tax Assessment Total Assessment is a certain percentage of the fair market value that is determined by local assessors to be the total taxable value of land and additions on the property. | Land | Improvement |
|---|---|---|---|---|
| 2025 | -- | $43,700 | $0 | $0 |
| 2024 | -- | $43,700 | $8,250 | $35,450 |
| 2023 | $647 | $43,700 | $8,250 | $35,450 |
| 2022 | $1,711 | $43,700 | $8,250 | $35,450 |
| 2021 | $1,554 | $43,700 | $8,250 | $35,450 |
| 2020 | $1,344 | $43,700 | $8,250 | $35,450 |
| 2019 | $1,344 | $30,325 | $5,250 | $25,075 |
| 2018 | $1,313 | $30,325 | $5,250 | $25,075 |
| 2017 | $1,313 | $30,325 | $5,250 | $25,075 |
| 2016 | $1,301 | $30,325 | $5,250 | $25,075 |
| 2015 | $1,301 | $30,325 | $5,250 | $25,075 |
| 2014 | $879 | $22,434 | $0 | $0 |
Source: Public Records
Map
Nearby Homes