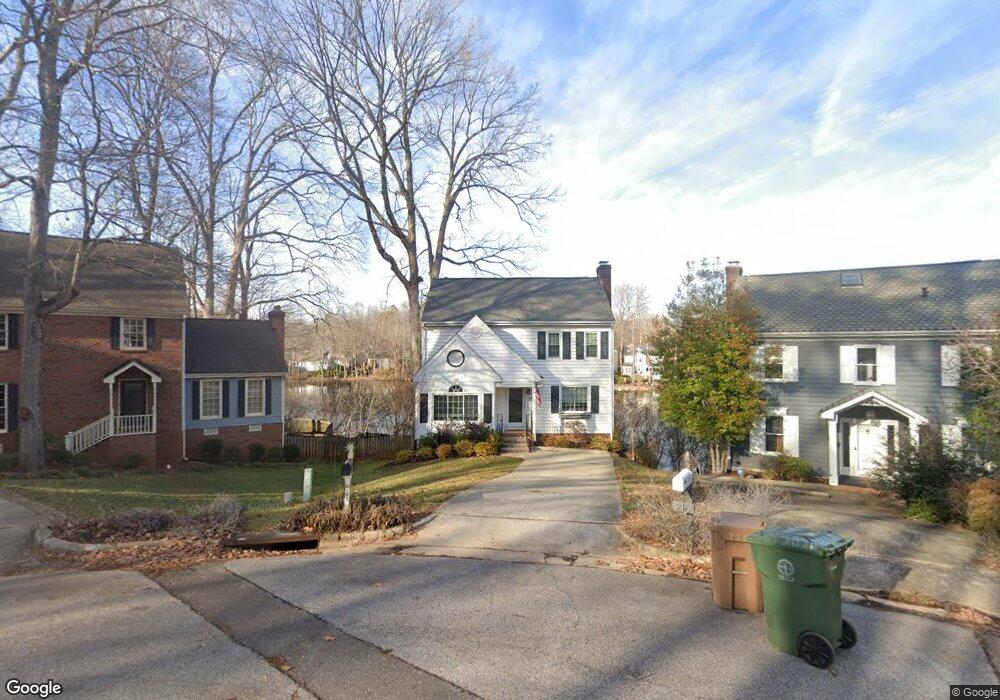
217 Lighthouse Way Cary, NC 27511
South Cary NeighborhoodEstimated Value: $570,000 - $647,297
4
Beds
4
Baths
2,339
Sq Ft
$256/Sq Ft
Est. Value
About This Home
This home is located at 217 Lighthouse Way, Cary, NC 27511 and is currently estimated at $598,574, approximately $255 per square foot. 217 Lighthouse Way is a home located in Wake County with nearby schools including Briarcliff Elementary School, East Cary Middle School, and Cary High School.
Ownership History
Date
Name
Owned For
Owner Type
Purchase Details
Closed on
Mar 20, 2017
Sold by
Glidden Jamie Lynn and Sherwood Jason Christopher
Bought by
Bao Haiyin
Current Estimated Value
Purchase Details
Closed on
May 16, 2013
Sold by
Cunco Matthew and Vazquez Milka
Bought by
Glidden Jamie Lynn and Sherwood Jason Christopher
Home Financials for this Owner
Home Financials are based on the most recent Mortgage that was taken out on this home.
Original Mortgage
$232,000
Interest Rate
3.56%
Mortgage Type
New Conventional
Purchase Details
Closed on
Apr 12, 2010
Sold by
Prosser Gail
Bought by
Cuneo Matthew and Vazquez Milka
Home Financials for this Owner
Home Financials are based on the most recent Mortgage that was taken out on this home.
Original Mortgage
$180,000
Interest Rate
5.02%
Mortgage Type
New Conventional
Purchase Details
Closed on
Dec 28, 2008
Sold by
Prosser Gail
Bought by
Prosser Gail
Create a Home Valuation Report for This Property
The Home Valuation Report is an in-depth analysis detailing your home's value as well as a comparison with similar homes in the area
Home Values in the Area
Average Home Value in this Area
Purchase History
| Date | Buyer | Sale Price | Title Company |
|---|---|---|---|
| Bao Haiyin | $324,500 | None Available | |
| Glidden Jamie Lynn | $290,000 | None Available | |
| Cuneo Matthew | $238,500 | None Available | |
| Prosser Gail | -- | None Available |
Source: Public Records
Mortgage History
| Date | Status | Borrower | Loan Amount |
|---|---|---|---|
| Previous Owner | Glidden Jamie Lynn | $232,000 | |
| Previous Owner | Cuneo Matthew | $180,000 |
Source: Public Records
Tax History Compared to Growth
Tax History
| Year | Tax Paid | Tax Assessment Tax Assessment Total Assessment is a certain percentage of the fair market value that is determined by local assessors to be the total taxable value of land and additions on the property. | Land | Improvement |
|---|---|---|---|---|
| 2025 | $5,200 | $604,385 | $315,000 | $289,385 |
| 2024 | $5,088 | $604,385 | $315,000 | $289,385 |
| 2023 | $3,427 | $339,972 | $132,300 | $207,672 |
| 2022 | $3,299 | $339,972 | $132,300 | $207,672 |
| 2021 | $3,233 | $339,972 | $132,300 | $207,672 |
| 2020 | $3,250 | $339,972 | $132,300 | $207,672 |
| 2019 | $3,299 | $306,235 | $121,500 | $184,735 |
| 2018 | $3,096 | $306,235 | $121,500 | $184,735 |
| 2017 | $2,975 | $306,235 | $121,500 | $184,735 |
| 2016 | $2,931 | $306,235 | $121,500 | $184,735 |
| 2015 | $2,407 | $242,415 | $88,400 | $154,015 |
| 2014 | $2,270 | $242,415 | $88,400 | $154,015 |
Source: Public Records
Map
Nearby Homes
- 103 Lakeway Ct
- 103 Kingsmill Rd
- 113 Breakers Place
- 134 Riverwalk Cir
- 113 Spring Cove Dr
- 106 Wimbledon Ct
- 1000 Brookgreen Dr
- 107 Bonnell Ct
- 103 Bonnell Ct
- 100 Brush Stream Dr
- 114 Brush Stream Dr
- 105 Brush Stream Dr
- 308 Virens Dr
- 102 Climbing Ivy Ct
- 806 Oakley Ct
- 703 Brookgreen Dr
- 501 Queensferry Rd
- 910 Balmoral Dr
- 114 Drummond Place
- 104 Charter Ct
- 215 Lighthouse Way
- 216 Lighthouse Way
- 213 Lighthouse Way
- 214 Lighthouse Way
- 211 Lighthouse Way
- 112 Topsail Ct
- 212 Lighthouse Way
- 114 Topsail Ct
- 210 Lighthouse Way
- 110 Topsail Ct
- 209 Lighthouse Way
- 208 Lighthouse Way
- 116 Topsail Ct
- 108 Topsail Ct
- 113 Leeward Ct
- 207 Lighthouse Way
- 111 Leeward Ct
- 206 Lighthouse Way
- 115 Leeward Ct
- 106 Topsail Ct