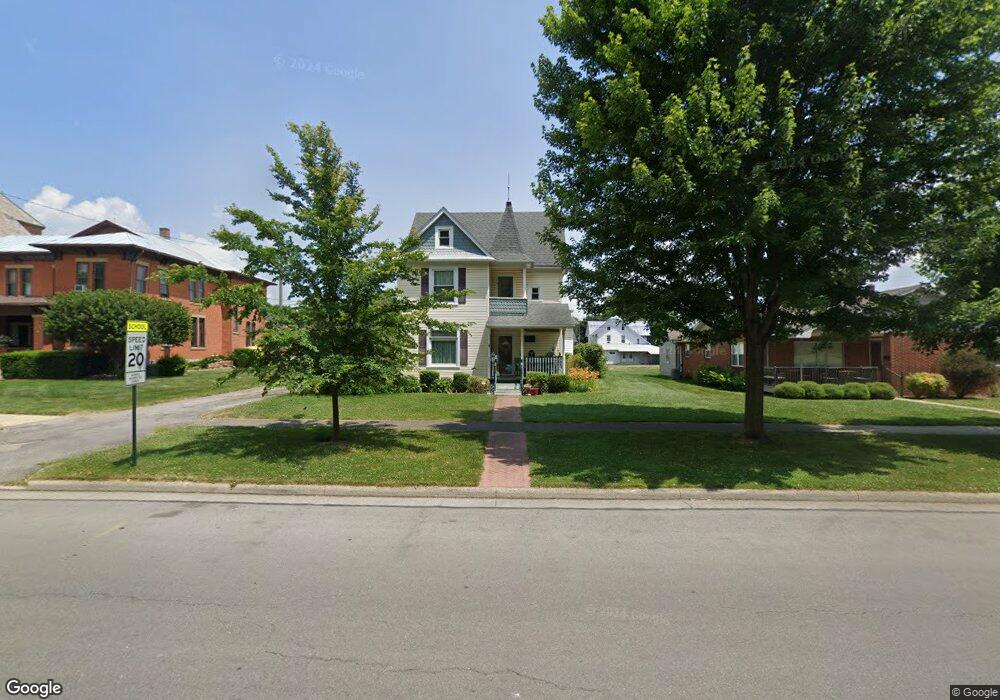
217 N 8th St Upper Sandusky, OH 43351
Estimated Value: $159,000 - $181,000
3
Beds
1
Bath
1,612
Sq Ft
$107/Sq Ft
Est. Value
About This Home
This home is located at 217 N 8th St, Upper Sandusky, OH 43351 and is currently estimated at $172,093, approximately $106 per square foot. 217 N 8th St is a home located in Wyandot County with nearby schools including Upper Sandusky High School and St. Peter Elementary School.
Ownership History
Date
Name
Owned For
Owner Type
Purchase Details
Closed on
Jan 31, 2017
Sold by
Lust Robert Orrin
Bought by
Koppenhafer Connie L
Current Estimated Value
Purchase Details
Closed on
Jul 10, 2006
Sold by
Wessler Daniel K and Wessler Kenneth E
Bought by
Guckenberger John D and Guckenberger Shirley J
Purchase Details
Closed on
Jun 27, 2005
Sold by
Hotelling Dana J and Hotelling Arron T
Bought by
Wessler Daniel K and Wessler Kenneth E
Home Financials for this Owner
Home Financials are based on the most recent Mortgage that was taken out on this home.
Original Mortgage
$70,326
Interest Rate
5.69%
Create a Home Valuation Report for This Property
The Home Valuation Report is an in-depth analysis detailing your home's value as well as a comparison with similar homes in the area
Home Values in the Area
Average Home Value in this Area
Purchase History
| Date | Buyer | Sale Price | Title Company |
|---|---|---|---|
| Koppenhafer Connie L | -- | None Available | |
| Guckenberger John D | $144,400 | None Available | |
| Wessler Daniel K | $54,500 | None Available |
Source: Public Records
Mortgage History
| Date | Status | Borrower | Loan Amount |
|---|---|---|---|
| Previous Owner | Wessler Daniel K | $70,326 |
Source: Public Records
Tax History
| Year | Tax Paid | Tax Assessment Tax Assessment Total Assessment is a certain percentage of the fair market value that is determined by local assessors to be the total taxable value of land and additions on the property. | Land | Improvement |
|---|---|---|---|---|
| 2025 | $1,443 | $58,130 | $5,210 | $52,920 |
| 2024 | $1,249 | $49,060 | $4,290 | $44,770 |
| 2023 | $1,249 | $49,060 | $4,290 | $44,770 |
| 2022 | $1,283 | $42,700 | $3,900 | $38,800 |
| 2021 | $1,131 | $42,700 | $3,900 | $38,800 |
| 2020 | $1,131 | $42,700 | $3,900 | $38,800 |
| 2019 | $1,129 | $42,700 | $3,900 | $38,800 |
| 2018 | $835 | $34,330 | $3,260 | $31,070 |
| 2017 | $848 | $34,330 | $3,260 | $31,070 |
| 2016 | $794 | $34,330 | $3,260 | $31,070 |
| 2015 | -- | $33,090 | $3,260 | $29,830 |
| 2014 | -- | $33,090 | $3,260 | $29,830 |
| 2013 | -- | $33,090 | $3,260 | $29,830 |
Source: Public Records
Map
Nearby Homes
- 137 N 8th St
- 116 E Walker St
- 386 W Finley St
- 346 W Hicks St
- 225 S Hazel St
- 333 N 5th St
- 314 N 4th St
- 326 S 8th St
- 334 N 4th St
- 445 N Sandusky Ave
- 430 S Sandusky Ave
- 479 N 5th St
- 432 E Bigelow St
- 387 S Warpole St
- 479 Front St
- 105 Old Lincoln Hwy
- 379 W Spring St
- 9768 County Highway 111
- 109 Rivers Edge Ln
- 123 Rivers Edge Ln
Your Personal Tour Guide
Ask me questions while you tour the home.