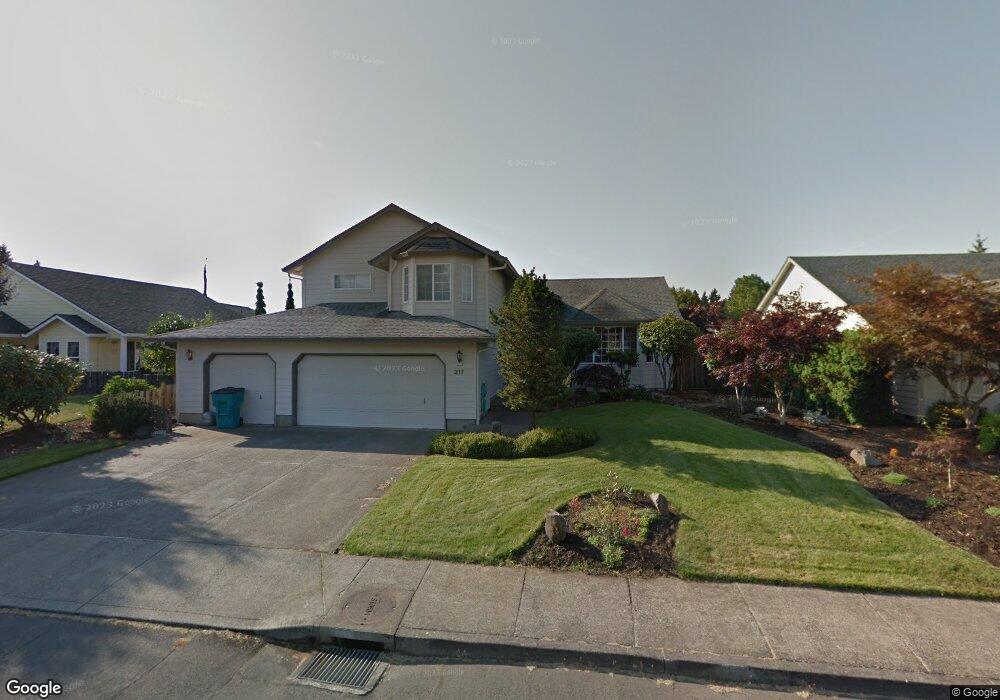
217 NE 136th St Vancouver, WA 98685
Knapp NeighborhoodEstimated Value: $548,000 - $669,000
4
Beds
3
Baths
2,147
Sq Ft
$274/Sq Ft
Est. Value
About This Home
This home is located at 217 NE 136th St, Vancouver, WA 98685 and is currently estimated at $588,569, approximately $274 per square foot. 217 NE 136th St is a home located in Clark County with nearby schools including Chinook Elementary School, Alki Middle School, and Skyview High School.
Ownership History
Date
Name
Owned For
Owner Type
Purchase Details
Closed on
Feb 16, 2023
Sold by
Clopton Gregory L
Bought by
Clopton Living Trust
Current Estimated Value
Purchase Details
Closed on
Jun 28, 2010
Sold by
Anderson Cara L
Bought by
Clopton Gregory L
Purchase Details
Closed on
Mar 29, 2004
Sold by
Devincenzi Dean R and Devincenzi Isabella M
Bought by
Clopton Greg and Anderson Cara Lynne
Home Financials for this Owner
Home Financials are based on the most recent Mortgage that was taken out on this home.
Original Mortgage
$164,000
Interest Rate
5.57%
Mortgage Type
Purchase Money Mortgage
Purchase Details
Closed on
Sep 17, 1998
Sold by
Devincenzi Isabella
Bought by
Devincenzi Dean R and Devincenzi Isabella M
Purchase Details
Closed on
May 9, 1996
Sold by
B I Gentry Construction Co Inc
Bought by
Devincenzi Dean R and Devincenzi Isabella
Home Financials for this Owner
Home Financials are based on the most recent Mortgage that was taken out on this home.
Original Mortgage
$188,088
Interest Rate
7.68%
Mortgage Type
Assumption
Create a Home Valuation Report for This Property
The Home Valuation Report is an in-depth analysis detailing your home's value as well as a comparison with similar homes in the area
Home Values in the Area
Average Home Value in this Area
Purchase History
| Date | Buyer | Sale Price | Title Company |
|---|---|---|---|
| Clopton Living Trust | -- | -- | |
| Clopton Gregory L | -- | None Available | |
| Clopton Greg | $273,000 | Stewart Title | |
| Devincenzi Dean R | -- | Clark County Title Company | |
| Devincenzi Dean R | $184,400 | Chicago Title Insurance Co |
Source: Public Records
Mortgage History
| Date | Status | Borrower | Loan Amount |
|---|---|---|---|
| Previous Owner | Clopton Greg | $164,000 | |
| Previous Owner | Devincenzi Dean R | $188,088 |
Source: Public Records
Tax History Compared to Growth
Tax History
| Year | Tax Paid | Tax Assessment Tax Assessment Total Assessment is a certain percentage of the fair market value that is determined by local assessors to be the total taxable value of land and additions on the property. | Land | Improvement |
|---|---|---|---|---|
| 2025 | $5,203 | $533,975 | $211,600 | $322,375 |
| 2024 | $4,981 | $492,703 | $211,600 | $281,103 |
| 2023 | $4,773 | $532,243 | $218,500 | $313,743 |
| 2022 | $4,639 | $484,797 | $218,500 | $266,297 |
| 2021 | $4,373 | $419,779 | $157,500 | $262,279 |
| 2020 | $4,022 | $371,222 | $144,000 | $227,222 |
| 2019 | $3,761 | $362,736 | $144,000 | $218,736 |
| 2018 | $4,039 | $351,982 | $0 | $0 |
| 2017 | $3,635 | $315,581 | $0 | $0 |
| 2016 | $3,556 | $295,765 | $0 | $0 |
| 2015 | $3,476 | $270,559 | $0 | $0 |
| 2014 | -- | $255,338 | $0 | $0 |
| 2013 | -- | $233,618 | $0 | $0 |
Source: Public Records
Map
Nearby Homes
- 306 NW 134th St
- 13419 NE 6th Ct
- 911 NE Tenney Rd
- 14204 NE 10th Ave Unit 6
- 14204 NE 10th Ave
- 13846 NW 10th Ct
- 508 NE 127th St
- 13114 NW 8th Way Unit B
- 516 NE 127th St
- 13821 NW 10th Ct Unit H
- 13821 NW 10th Ct Unit G
- 13813 NW 10th Ct Unit C
- 13311 NW 10th Ave
- 13802 NW 10th Ct Unit D
- 13802 NW 10th Ct
- 14411 NE 8th Ct
- 1003 NW 139th St Unit 3B
- 1207 NE Knowles Dr
- 901 NW 132nd St Unit A
- 1312 NE 131st Cir
- 301 NE 136th St
- 209 NE 136th St
- 13515 NE 2nd Ct
- 13514 NE 3rd Ct
- 207 NE 136th St
- 305 NE 136th St
- 216 NE 136th St
- 13508 NE 3rd Ct
- 212 NE 136th St
- 13511 NE 2nd Ct
- 302 NE 136th St
- 13514 NE 2nd Ct
- 208 NE 136th St
- 306 NE 136th St
- 203 NE 136th St
- 311 NE 136th St
- 13511 NE 3rd Ct
- 214 NE 135th St
- 210 NE 135th St
- 204 NE 136th St