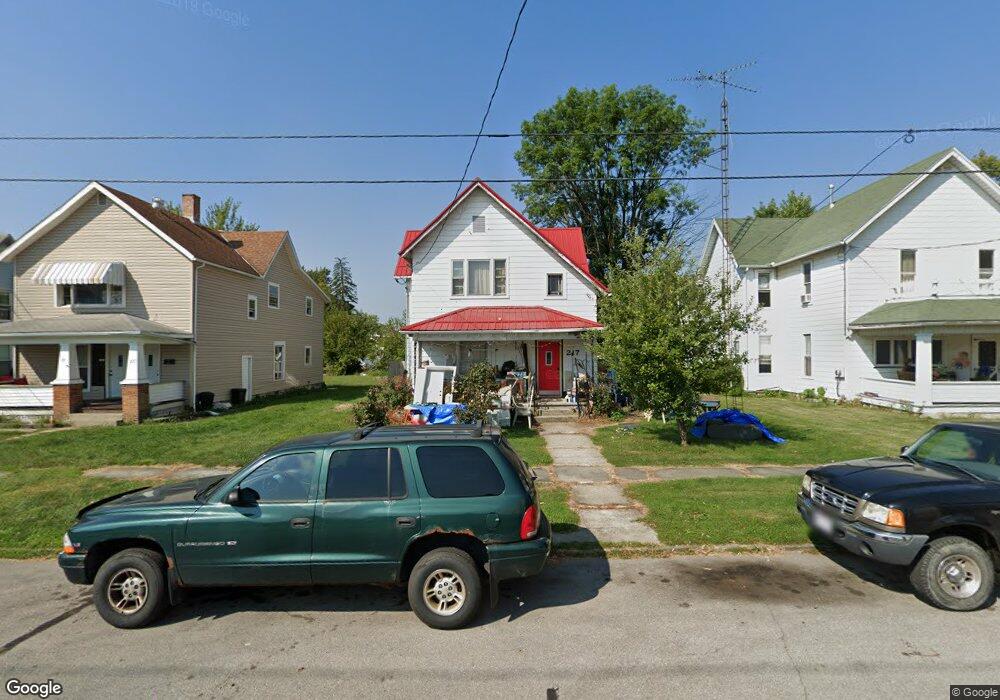
217 Orchard St Marion, OH 43302
Estimated Value: $105,000 - $182,000
4
Beds
1
Bath
1,848
Sq Ft
$79/Sq Ft
Est. Value
About This Home
This home is located at 217 Orchard St, Marion, OH 43302 and is currently estimated at $146,278, approximately $79 per square foot. 217 Orchard St is a home located in Marion County with nearby schools including James A. Garfield Elementary School, Ulysses S. Grant Middle School, and Harding High School.
Ownership History
Date
Name
Owned For
Owner Type
Purchase Details
Closed on
Mar 25, 2009
Sold by
Lsf6 Mercury Reo Investments Llc
Bought by
Mcdaniel John E
Current Estimated Value
Purchase Details
Closed on
Oct 15, 2008
Sold by
The Cit Group Consumer Finance Inc
Bought by
Lsf6 Mercury Reo Investments Llc
Purchase Details
Closed on
Mar 17, 2008
Sold by
Davis Antoniette L
Bought by
Cit Group/Consumer Finance Inc
Purchase Details
Closed on
May 5, 1995
Bought by
Mcdaniel John E
Create a Home Valuation Report for This Property
The Home Valuation Report is an in-depth analysis detailing your home's value as well as a comparison with similar homes in the area
Home Values in the Area
Average Home Value in this Area
Purchase History
| Date | Buyer | Sale Price | Title Company |
|---|---|---|---|
| Mcdaniel John E | $9,800 | Ryan/Nationa Title Agency | |
| Lsf6 Mercury Reo Investments Llc | $14,000 | None Available | |
| Cit Group/Consumer Finance Inc | -- | None Available | |
| Mcdaniel John E | $18,000 | -- |
Source: Public Records
Tax History Compared to Growth
Tax History
| Year | Tax Paid | Tax Assessment Tax Assessment Total Assessment is a certain percentage of the fair market value that is determined by local assessors to be the total taxable value of land and additions on the property. | Land | Improvement |
|---|---|---|---|---|
| 2024 | $923 | $16,680 | $1,950 | $14,730 |
| 2023 | $923 | $16,680 | $1,950 | $14,730 |
| 2022 | $958 | $16,680 | $1,950 | $14,730 |
| 2021 | $820 | $13,390 | $1,700 | $11,690 |
| 2020 | $828 | $13,390 | $1,700 | $11,690 |
| 2019 | $870 | $13,390 | $1,700 | $11,690 |
| 2018 | $974 | $7,820 | $1,670 | $6,150 |
| 2017 | $650 | $7,820 | $1,670 | $6,150 |
| 2016 | $312 | $7,820 | $1,670 | $6,150 |
| 2015 | $312 | $7,640 | $1,590 | $6,050 |
| 2014 | $698 | $7,640 | $1,590 | $6,050 |
| 2012 | $331 | $8,050 | $1,810 | $6,240 |
Source: Public Records
Map
Nearby Homes
- 198 Windsor St
- 325 Holmes Place
- 374 Nunin Ct
- 302 Blaine Ave
- 341 Girard Ave
- 429 W Columbia St
- 178 Leader St
- 354 Bellefontaine Ave
- 236 Silver St
- 347 Mary St
- 343 Commercial St
- 546 Cherry St
- 301 S Vine St
- 426 Bellefontaine Ave
- 545 Blaine Ave
- 559 Pearl St
- 233 Tully St
- 239 Gurley Ave
- 593 Windsor St
- 375 N Main St
- 217 Orchard St
- 211 Orchard St
- 225 Orchard St
- 205 Orchard St
- 231 Orchard St
- 201 Orchard St
- 237 Orchard St
- 195 Orchard St
- 307 Kennedy Ct
- 214 Windsor St
- 210 Windsor St
- 245 Orchard St
- 251 Orchard St
- 285-287 285 Church W
- 285-287 285 W Church St
- 244 Windsor St
- 220 Windsor St
- 206 Windsor St
- 259 Orchard St
- 250 Windsor St