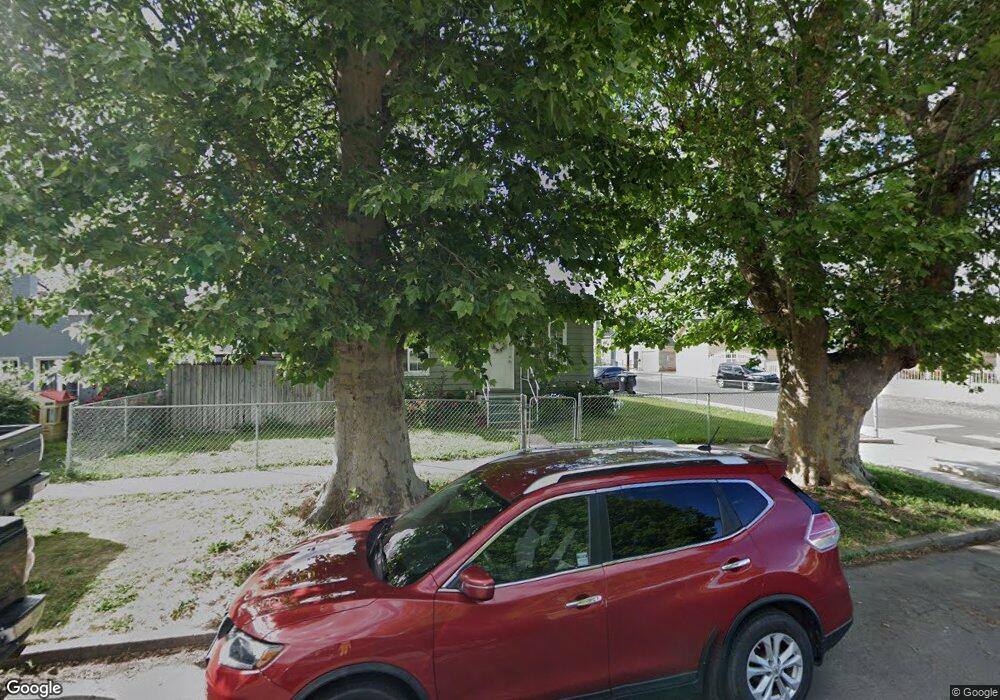
217 Pearne St Toppenish, WA 98948
Estimated Value: $245,853 - $305,000
4
Beds
2
Baths
1,416
Sq Ft
$189/Sq Ft
Est. Value
About This Home
This home is located at 217 Pearne St, Toppenish, WA 98948 and is currently estimated at $267,963, approximately $189 per square foot. 217 Pearne St is a home located in Yakima County with nearby schools including Toppenish High School.
Ownership History
Date
Name
Owned For
Owner Type
Purchase Details
Closed on
Apr 21, 1998
Sold by
Lloyd Cook Rentals Llc
Bought by
Moran Eduardo C and Lujano Maribel
Current Estimated Value
Home Financials for this Owner
Home Financials are based on the most recent Mortgage that was taken out on this home.
Original Mortgage
$85,500
Outstanding Balance
$16,301
Interest Rate
7.15%
Estimated Equity
$251,662
Purchase Details
Closed on
Mar 10, 1994
Sold by
Kormil Mary Angeline
Bought by
Cook Lloyd D and Cook Charlotte J
Create a Home Valuation Report for This Property
The Home Valuation Report is an in-depth analysis detailing your home's value as well as a comparison with similar homes in the area
Home Values in the Area
Average Home Value in this Area
Purchase History
| Date | Buyer | Sale Price | Title Company |
|---|---|---|---|
| Moran Eduardo C | $90,000 | Schreiner Title Company | |
| Cook Lloyd D | -- | Schreiner Title Company |
Source: Public Records
Mortgage History
| Date | Status | Borrower | Loan Amount |
|---|---|---|---|
| Open | Moran Eduardo C | $85,500 |
Source: Public Records
Tax History Compared to Growth
Tax History
| Year | Tax Paid | Tax Assessment Tax Assessment Total Assessment is a certain percentage of the fair market value that is determined by local assessors to be the total taxable value of land and additions on the property. | Land | Improvement |
|---|---|---|---|---|
| 2025 | $2,049 | $239,200 | $26,500 | $212,700 |
| 2023 | $2,136 | $225,600 | $32,200 | $193,400 |
| 2022 | $2,596 | $230,400 | $32,000 | $198,400 |
| 2021 | $2,348 | $168,000 | $24,800 | $143,200 |
| 2019 | $1,715 | $147,000 | $24,800 | $122,200 |
| 2018 | $1,419 | $120,900 | $24,800 | $96,100 |
| 2017 | $1,242 | $118,700 | $24,800 | $93,900 |
| 2016 | $1,238 | $119,350 | $24,750 | $94,600 |
| 2015 | $1,238 | $112,750 | $24,750 | $88,000 |
| 2014 | $1,238 | $113,750 | $24,750 | $89,000 |
| 2013 | $1,238 | $113,750 | $24,750 | $89,000 |
Source: Public Records
Map
Nearby Homes