Estimated Value: $376,000 - $419,000
5
Beds
2
Baths
2,810
Sq Ft
$142/Sq Ft
Est. Value
About This Home
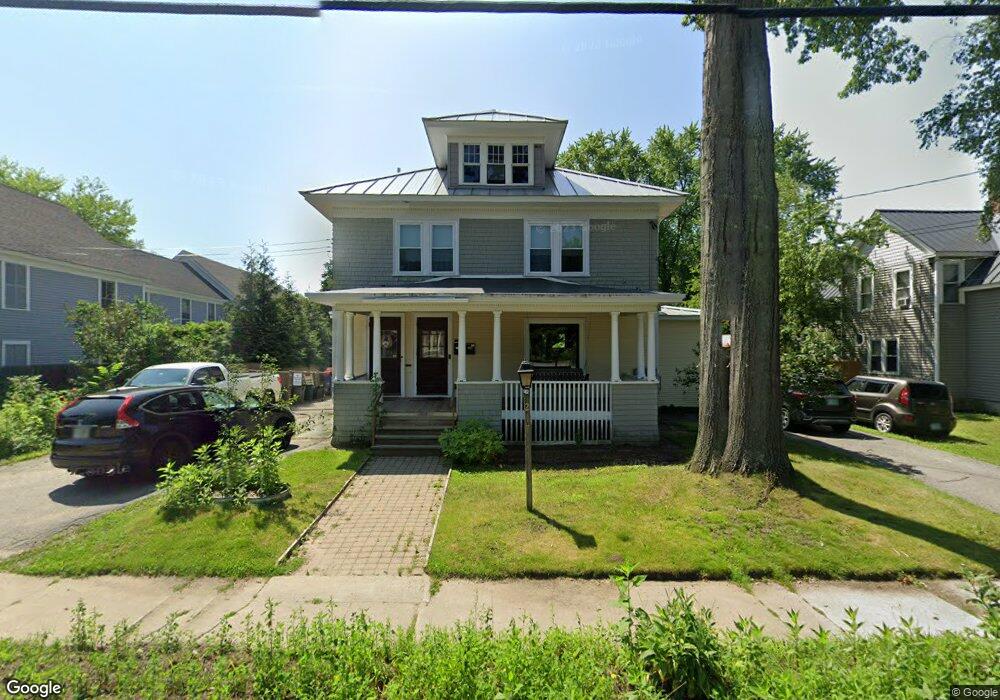
This home is located at 217 Roxbury St, Keene, NH 03431 and is currently estimated at $398,969, approximately $141 per square foot. 217 Roxbury St is a home with nearby schools including Franklin Elementary School, Keene Middle School, and Keene High School.
Ownership History
Date
Name
Owned For
Owner Type
Purchase Details
Closed on
May 1, 2018
Sold by
Muskus Kryzstof J and Muskus Maria K
Bought by
Mft Ret
Current Estimated Value
Purchase Details
Closed on
Apr 3, 2018
Sold by
Muskus Krzysztof J and Muskus Maria K
Bought by
Muskus Ft
Purchase Details
Closed on
Aug 17, 2001
Sold by
Tkatch David F and Tkatch Deborah A
Bought by
Muskus Krzysztof J and Muskus Maria K
Home Financials for this Owner
Home Financials are based on the most recent Mortgage that was taken out on this home.
Original Mortgage
$153,900
Interest Rate
7.16%
Create a Home Valuation Report for This Property
The Home Valuation Report is an in-depth analysis detailing your home's value as well as a comparison with similar homes in the area
Home Values in the Area
Average Home Value in this Area
Purchase History
| Date | Buyer | Sale Price | Title Company |
|---|---|---|---|
| Mft Ret | -- | -- | |
| Muskus Ft | -- | -- | |
| Muskus Krzysztof J | $162,000 | -- |
Source: Public Records
Mortgage History
| Date | Status | Borrower | Loan Amount |
|---|---|---|---|
| Previous Owner | Muskus Krzysztof J | $153,900 |
Source: Public Records
Tax History Compared to Growth
Tax History
| Year | Tax Paid | Tax Assessment Tax Assessment Total Assessment is a certain percentage of the fair market value that is determined by local assessors to be the total taxable value of land and additions on the property. | Land | Improvement |
|---|---|---|---|---|
| 2024 | $8,926 | $269,900 | $42,900 | $227,000 |
| 2023 | $8,607 | $269,900 | $42,900 | $227,000 |
| 2022 | $7,913 | $255,000 | $42,900 | $212,100 |
| 2021 | $7,867 | $251,500 | $42,900 | $208,600 |
| 2020 | $7,769 | $208,400 | $50,300 | $158,100 |
| 2019 | $7,836 | $208,400 | $50,300 | $158,100 |
| 2018 | $7,736 | $208,400 | $50,300 | $158,100 |
| 2017 | $7,753 | $208,300 | $50,200 | $158,100 |
| 2016 | $7,580 | $208,300 | $50,200 | $158,100 |
Source: Public Records
Map
Nearby Homes