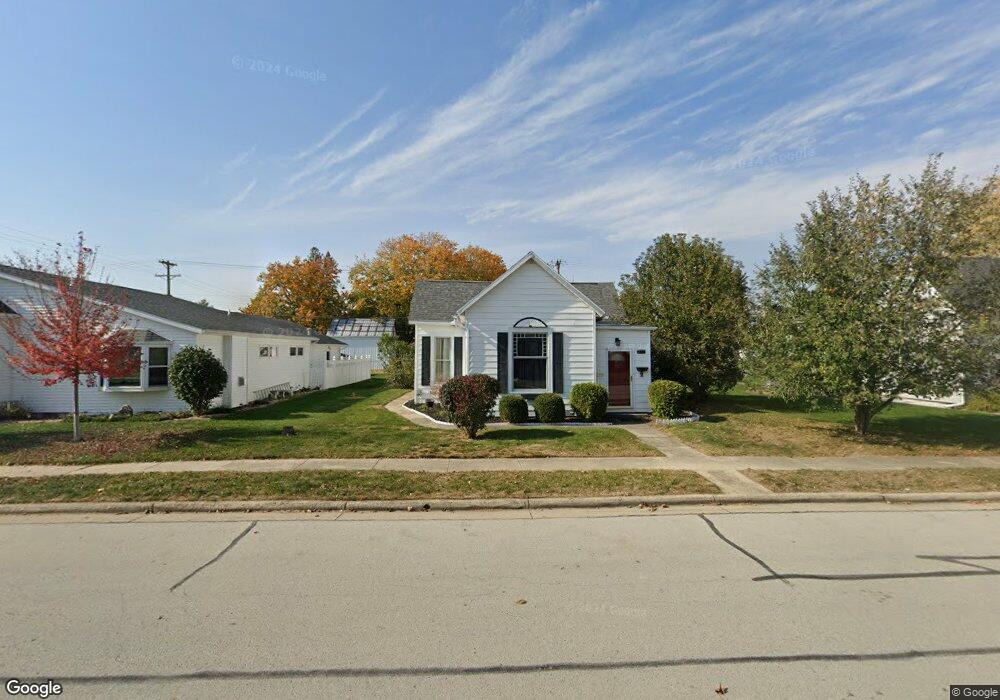
217 S Walnut St New Bremen, OH 45869
Estimated Value: $165,000 - $264,000
3
Beds
2
Baths
1,277
Sq Ft
$164/Sq Ft
Est. Value
About This Home
This home is located at 217 S Walnut St, New Bremen, OH 45869 and is currently estimated at $209,223, approximately $163 per square foot. 217 S Walnut St is a home located in Auglaize County with nearby schools including New Bremen Elementary School and New Bremen High School.
Ownership History
Date
Name
Owned For
Owner Type
Purchase Details
Closed on
Jul 21, 2016
Sold by
Cisco Veryl S
Bought by
Blagg Christoppher Lee
Current Estimated Value
Home Financials for this Owner
Home Financials are based on the most recent Mortgage that was taken out on this home.
Original Mortgage
$90,000
Outstanding Balance
$71,615
Interest Rate
3.48%
Mortgage Type
New Conventional
Estimated Equity
$137,608
Purchase Details
Closed on
Jan 27, 2010
Sold by
Zimpfer Ryan W and Zimpfer Erin L
Bought by
Good Ole Boys Inc
Home Financials for this Owner
Home Financials are based on the most recent Mortgage that was taken out on this home.
Original Mortgage
$59,000
Interest Rate
5.09%
Mortgage Type
Future Advance Clause Open End Mortgage
Purchase Details
Closed on
Oct 22, 2007
Sold by
Topp Gertrude
Bought by
Zimpfer Ryan W and Zimpfer Erin L
Home Financials for this Owner
Home Financials are based on the most recent Mortgage that was taken out on this home.
Original Mortgage
$41,400
Interest Rate
6.38%
Mortgage Type
Purchase Money Mortgage
Create a Home Valuation Report for This Property
The Home Valuation Report is an in-depth analysis detailing your home's value as well as a comparison with similar homes in the area
Home Values in the Area
Average Home Value in this Area
Purchase History
| Date | Buyer | Sale Price | Title Company |
|---|---|---|---|
| Blagg Christoppher Lee | $100,000 | Tenure Title Agency | |
| Good Ole Boys Inc | $75,000 | Attorney | |
| Zimpfer Ryan W | $46,000 | Attorney |
Source: Public Records
Mortgage History
| Date | Status | Borrower | Loan Amount |
|---|---|---|---|
| Open | Blagg Christoppher Lee | $90,000 | |
| Previous Owner | Good Ole Boys Inc | $59,000 | |
| Previous Owner | Zimpfer Ryan W | $41,400 |
Source: Public Records
Tax History Compared to Growth
Tax History
| Year | Tax Paid | Tax Assessment Tax Assessment Total Assessment is a certain percentage of the fair market value that is determined by local assessors to be the total taxable value of land and additions on the property. | Land | Improvement |
|---|---|---|---|---|
| 2024 | $3,188 | $47,190 | $11,890 | $35,300 |
| 2023 | $1,666 | $47,190 | $11,890 | $35,300 |
| 2022 | $1,333 | $34,370 | $10,800 | $23,570 |
| 2021 | $1,313 | $34,370 | $10,800 | $23,570 |
| 2020 | $684 | $34,371 | $10,805 | $23,566 |
| 2019 | $1,125 | $27,923 | $8,778 | $19,145 |
| 2018 | $1,118 | $27,923 | $8,778 | $19,145 |
| 2017 | $1,122 | $27,923 | $8,778 | $19,145 |
| 2016 | $875 | $23,027 | $8,089 | $14,938 |
| 2015 | $853 | $23,027 | $8,089 | $14,938 |
| 2014 | $830 | $23,027 | $8,089 | $14,938 |
| 2013 | $852 | $23,027 | $8,089 | $14,938 |
Source: Public Records
Map
Nearby Homes
- 416 E Plum St
- 420 E Plum St
- 424 E Plum St
- 323 Margaret St
- 319 Margaret St
- 316 Margaret St
- 312 Margaret St
- 315 W Monroe St
- 209 N Water St
- 561 S Walnut St Unit Lot3
- 130 Janice Dr
- 129 Janice Dr
- 132 Janice Dr
- 136 Janice Dr
- 133 Janice Dr
- 137 Janice Dr
- 140 Janice Dr
- 144 Janice Dr
- 141 Janice Dr
- 511 N Main St
- 221 S Walnut St
- 213 S Walnut St
- 211 S Walnut St
- 224 S Washington St
- 232 S Washington St
- 220 S Walnut St
- 209 N Walnut St
- 220 S Washington St
- 303 S Walnut St
- 218 S Walnut St
- 222 S Walnut St
- 214 S Washington St
- 307 S Walnut St
- 207 S Walnut St
- 302 S Walnut St
- 0 St Rt 66 Unit 5046312
- 0 St Rt 66 Unit 270033
- 308 S Washington St
- 205 S Walnut St