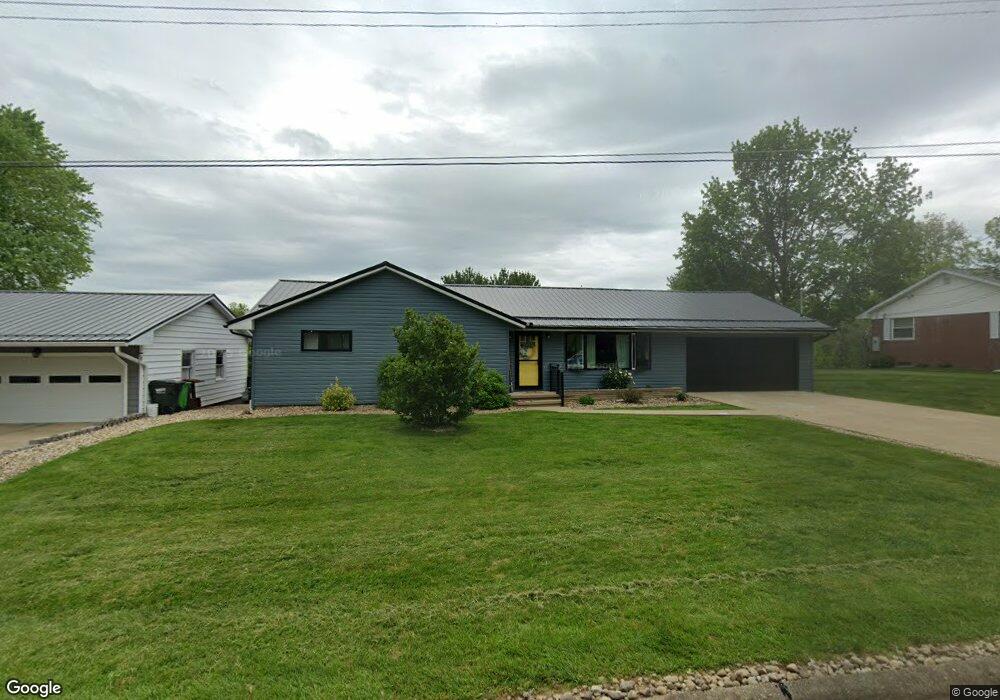
217 Westview Dr New Concord, OH 43762
Estimated Value: $176,000 - $257,000
3
Beds
2
Baths
1,404
Sq Ft
$166/Sq Ft
Est. Value
About This Home
This home is located at 217 Westview Dr, New Concord, OH 43762 and is currently estimated at $233,653, approximately $166 per square foot. 217 Westview Dr is a home located in Muskingum County with nearby schools including New Concord Elementary School, East Muskingum Middle School, and Larry Miller Intermediate Elementary School.
Ownership History
Date
Name
Owned For
Owner Type
Purchase Details
Closed on
Mar 30, 2021
Sold by
Parrish Mark A and Parrish Gwen G
Bought by
Smith Dana M and Smith Tina
Current Estimated Value
Home Financials for this Owner
Home Financials are based on the most recent Mortgage that was taken out on this home.
Original Mortgage
$161,500
Interest Rate
3%
Mortgage Type
New Conventional
Purchase Details
Closed on
Jun 1, 2016
Sold by
Robert W Russell
Bought by
Fitzgerald Devin and Zaleski Shelby
Home Financials for this Owner
Home Financials are based on the most recent Mortgage that was taken out on this home.
Original Mortgage
$138,700
Interest Rate
3.64%
Purchase Details
Closed on
May 31, 2016
Sold by
Russell Robert W & Mary M Trustees
Bought by
Fitzgerald Devin R
Home Financials for this Owner
Home Financials are based on the most recent Mortgage that was taken out on this home.
Original Mortgage
$138,700
Interest Rate
3.64%
Purchase Details
Closed on
Jul 2, 2007
Sold by
Morgan Sharon L Emler
Bought by
Russell Robert W and Russell Mary M
Purchase Details
Closed on
Jul 6, 1993
Bought by
Emler Dorothy
Create a Home Valuation Report for This Property
The Home Valuation Report is an in-depth analysis detailing your home's value as well as a comparison with similar homes in the area
Home Values in the Area
Average Home Value in this Area
Purchase History
| Date | Buyer | Sale Price | Title Company |
|---|---|---|---|
| Smith Dana M | -- | New Title Company Name | |
| Fitzgerald Devin | -- | -- | |
| Fitzgerald Devin R | $147,000 | -- | |
| Russell Robert W | $107,166 | Attorney | |
| Emler Dorothy | -- | -- |
Source: Public Records
Mortgage History
| Date | Status | Borrower | Loan Amount |
|---|---|---|---|
| Previous Owner | Smith Dana M | $161,500 | |
| Previous Owner | Fitzgerald Devin R | $138,700 | |
| Previous Owner | Fitzgerald Devin R | -- | |
| Previous Owner | Fitzgerald Devin R | -- |
Source: Public Records
Tax History Compared to Growth
Tax History
| Year | Tax Paid | Tax Assessment Tax Assessment Total Assessment is a certain percentage of the fair market value that is determined by local assessors to be the total taxable value of land and additions on the property. | Land | Improvement |
|---|---|---|---|---|
| 2024 | $2,161 | $61,740 | $9,835 | $51,905 |
| 2023 | $1,456 | $38,465 | $6,405 | $32,060 |
| 2022 | $1,429 | $38,465 | $6,405 | $32,060 |
| 2021 | $1,413 | $38,465 | $6,405 | $32,060 |
| 2020 | $1,450 | $38,465 | $6,405 | $32,060 |
| 2019 | $1,421 | $38,465 | $6,405 | $32,060 |
| 2018 | $1,450 | $38,465 | $6,405 | $32,060 |
| 2017 | $1,300 | $33,110 | $6,405 | $26,705 |
| 2016 | $1,336 | $33,120 | $6,410 | $26,710 |
| 2015 | $1,357 | $33,120 | $6,410 | $26,710 |
| 2013 | $1,040 | $33,120 | $6,410 | $26,710 |
Source: Public Records
Map
Nearby Homes
- 760 Friendship Dr
- 112 Thompson Ave
- 154 Montgomery Blvd
- 8 E Main St
- 0 Homestead Dr Unit 11611647
- 0 Homestead Dr Unit 5174212
- 485 Ash Cir
- 67 E Main St
- 12985 John Glenn School Rd
- 0 Rix Mills Rd
- 0 Maple Ln
- 60936 Patch Rd
- 1420 Glenn Hwy
- Lot 18 & 19 Greenbriar Dr
- 61220 Kadon Dr
- 10545 Main St
- 60040 Bliss Rd
- 0 Norfield Unit 5174011
- 0 Norfield Unit 5173946
- 3029 Best Rd
- 219 Westview Dr
- 215 Westview Dr
- 221 Westview Dr
- 211 Westview Dr
- 214 Westview Dr
- 218 Westview Dr
- 212 Westview Dr
- 220 Westview Dr
- 209 Westview Dr
- 183 Highland Dr
- 180 Highland Dr
- 440 Shadyside Dr
- 210 Westview Dr
- 207 Westview Dr
- 181 Highland Dr
- 178 Highland Dr
- 208 Westview Dr
- 205 Westview Dr
- 179 Highland Dr
- 176 Highland Dr