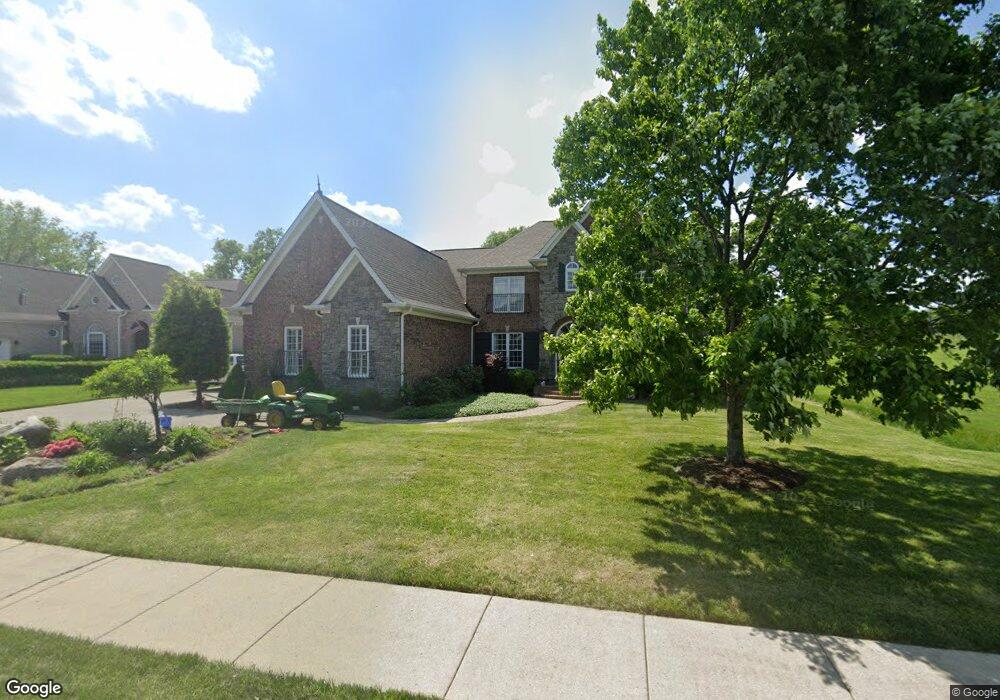
2170 Gorden Crossing Gallatin, TN 37066
Estimated Value: $1,034,000 - $1,205,517
--
Bed
5
Baths
4,849
Sq Ft
$235/Sq Ft
Est. Value
About This Home
This home is located at 2170 Gorden Crossing, Gallatin, TN 37066 and is currently estimated at $1,137,379, approximately $234 per square foot. 2170 Gorden Crossing is a home located in Sumner County with nearby schools including Jack Anderson Elementary School, Station Camp Middle School, and Station Camp High School.
Ownership History
Date
Name
Owned For
Owner Type
Purchase Details
Closed on
Sep 15, 2017
Sold by
Byron Timothy J and Byron Verneda M
Bought by
Ellison Daniel R and Ellison Eileen S
Current Estimated Value
Purchase Details
Closed on
Jan 24, 2012
Sold by
Byron Timothy J and Byron Verneda M
Bought by
Byron Timothy J and Byron Verneda M
Home Financials for this Owner
Home Financials are based on the most recent Mortgage that was taken out on this home.
Original Mortgage
$415,000
Interest Rate
3.91%
Mortgage Type
New Conventional
Purchase Details
Closed on
Oct 16, 2007
Sold by
Byron Timothy J and Byron Verneda M
Bought by
The Byron Family Trust
Purchase Details
Closed on
Jan 9, 2007
Sold by
Bowden Building Corp
Bought by
Byron Timothy and Byron Verneda
Home Financials for this Owner
Home Financials are based on the most recent Mortgage that was taken out on this home.
Original Mortgage
$417,000
Interest Rate
6.14%
Mortgage Type
Purchase Money Mortgage
Create a Home Valuation Report for This Property
The Home Valuation Report is an in-depth analysis detailing your home's value as well as a comparison with similar homes in the area
Home Values in the Area
Average Home Value in this Area
Purchase History
| Date | Buyer | Sale Price | Title Company |
|---|---|---|---|
| Ellison Daniel R | $599,000 | None Available | |
| Byron Timothy J | -- | Brentwood Title & Escrow Llc | |
| The Byron Family Trust | -- | Pinnacle Title & Escrow Llc | |
| Byron Timothy | $583,202 | Bridgehouse Title Llc |
Source: Public Records
Mortgage History
| Date | Status | Borrower | Loan Amount |
|---|---|---|---|
| Previous Owner | Byron Timothy J | $415,000 | |
| Previous Owner | Byron Timothy | $417,000 |
Source: Public Records
Tax History Compared to Growth
Tax History
| Year | Tax Paid | Tax Assessment Tax Assessment Total Assessment is a certain percentage of the fair market value that is determined by local assessors to be the total taxable value of land and additions on the property. | Land | Improvement |
|---|---|---|---|---|
| 2024 | $3,819 | $268,750 | $40,500 | $228,250 |
| 2023 | $5,528 | $172,075 | $20,000 | $152,075 |
| 2022 | $5,545 | $172,075 | $20,000 | $152,075 |
| 2021 | $5,545 | $172,075 | $20,000 | $152,075 |
| 2020 | $5,545 | $172,075 | $20,000 | $152,075 |
| 2019 | $5,545 | $0 | $0 | $0 |
| 2018 | $4,102 | $0 | $0 | $0 |
| 2017 | $4,102 | $0 | $0 | $0 |
| 2016 | $4,102 | $0 | $0 | $0 |
| 2015 | -- | $0 | $0 | $0 |
| 2014 | -- | $0 | $0 | $0 |
Source: Public Records
Map
Nearby Homes
- 108 Drayton Downs
- 107 Jasmine Ct
- 100 Gaston St
- 107 Nogs Garden
- 108 Tipperton Ct
- 105 Mulberry Grove
- 209 Bellsford Rd
- 217 Bellsford Rd
- 2308 Cages Bend Rd
- 104 Houghland St
- 241 Bellsford Rd
- 404 Bell Lake Rd
- 253 Bellsford Rd
- 107 Stalbridge Ct
- 117 Vaughan St
- 129 Houghland St
- 310 Lisa Ln
- 318 W Lee Etta Dr
- 5045 Percival Dr
- 3211 Chaucer Ln
- 2170 Gorden Crossing
- 2172 Gordon Crossing
- 2174 Gordon Crossing
- 2174 Gorden Crossing
- 2173 Gorden Crossing
- 2173 Gorden Crossing
- 2176 Gorden Crossing
- 2171 Gordon Crossing
- 123 Gaston St
- 2175 Gorden Crossing
- 2175 Gordon Crossing
- 2167 Gorden Crossing
- 2177 Gordon Crossing
- 2180 Gordon Crossing
- 2180 Gorden Crossing
- 2181 Gorden Crossing
- 2162 Gorden Crossing
- 2182 Gordon Crossing
- 2182 Gorden Crossing
- 2188 Gorden Crossing