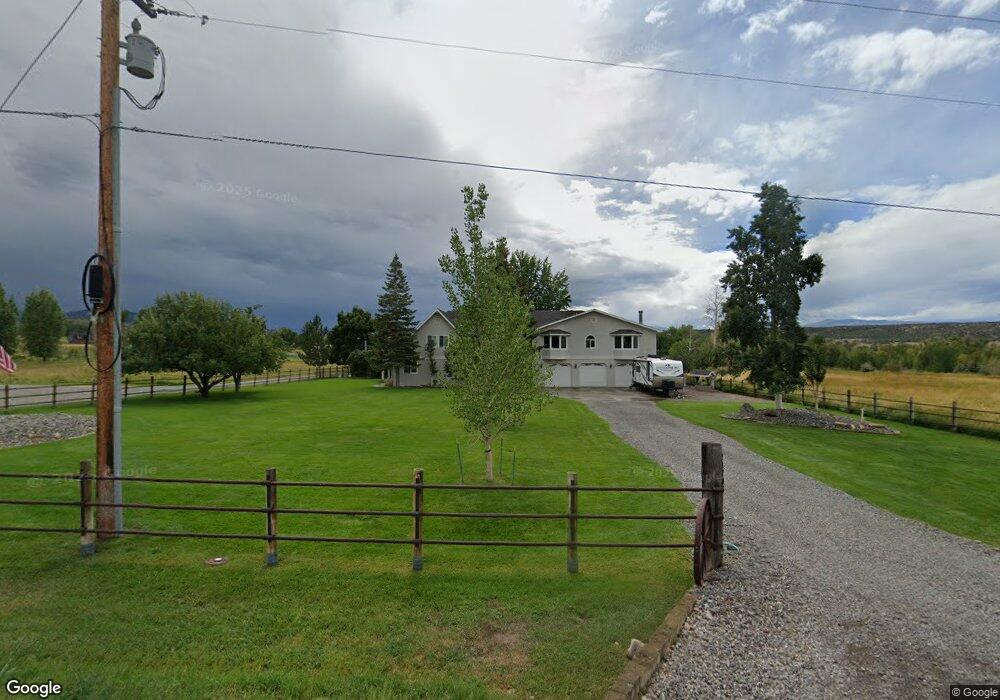
21707 Uncompahgre Rd Montrose, CO 81403
Estimated Value: $993,656 - $1,258,000
5
Beds
3
Baths
3,870
Sq Ft
$286/Sq Ft
Est. Value
About This Home
This home is located at 21707 Uncompahgre Rd, Montrose, CO 81403 and is currently estimated at $1,107,414, approximately $286 per square foot. 21707 Uncompahgre Rd is a home located in Montrose County with nearby schools including Cottonwood Elementary School, Centennial Middle School, and Montrose High School.
Ownership History
Date
Name
Owned For
Owner Type
Purchase Details
Closed on
Mar 22, 2019
Sold by
Hoops David P
Bought by
Hoops David P and Hoops Lauri
Current Estimated Value
Purchase Details
Closed on
Mar 19, 2002
Sold by
Hoops David P and Hoops Paul
Bought by
Hoops David P and Hoops Lauri
Purchase Details
Closed on
Mar 25, 1999
Sold by
Gurney Dennis E and Gurney Pamela R
Bought by
Hoops David P and Hoops Paul
Purchase Details
Closed on
Nov 3, 1989
Sold by
Peters Ronald L and Peters Marilynn G
Bought by
Gurney Dennis E and Gurney Pamela R
Purchase Details
Closed on
Aug 29, 1986
Sold by
Jones William K and Jones Betty C
Bought by
Peters Ronald L and Peters Marilynn G
Purchase Details
Closed on
May 1, 1981
Sold by
Buck Thomas W and Buck Patricia J
Bought by
Jones William K and Jones Betty C
Purchase Details
Closed on
Sep 26, 1978
Sold by
Mitchell Harold
Bought by
Buck Thomas W and Buck Patricia J
Create a Home Valuation Report for This Property
The Home Valuation Report is an in-depth analysis detailing your home's value as well as a comparison with similar homes in the area
Home Values in the Area
Average Home Value in this Area
Purchase History
| Date | Buyer | Sale Price | Title Company |
|---|---|---|---|
| Hoops David P | -- | Land Title Guarantee Co | |
| Hoops David P | -- | -- | |
| Hoops David P | $325,000 | -- | |
| Gurney Dennis E | $106,900 | -- | |
| Peters Ronald L | $92,500 | -- | |
| Jones William K | $85,000 | -- | |
| Buck Thomas W | $17,000 | -- |
Source: Public Records
Tax History Compared to Growth
Tax History
| Year | Tax Paid | Tax Assessment Tax Assessment Total Assessment is a certain percentage of the fair market value that is determined by local assessors to be the total taxable value of land and additions on the property. | Land | Improvement |
|---|---|---|---|---|
| 2024 | $3,874 | $54,410 | $10,230 | $44,180 |
| 2023 | $3,874 | $64,800 | $11,330 | $53,470 |
| 2022 | $2,973 | $43,200 | $7,580 | $35,620 |
| 2021 | $3,063 | $44,430 | $7,790 | $36,640 |
| 2020 | $2,533 | $37,750 | $7,090 | $30,660 |
| 2019 | $2,549 | $37,750 | $7,090 | $30,660 |
| 2018 | $2,296 | $33,160 | $5,100 | $28,060 |
| 2017 | $2,277 | $33,160 | $5,100 | $28,060 |
| 2016 | $2,204 | $32,630 | $5,130 | $27,500 |
| 2015 | $2,164 | $32,630 | $5,130 | $27,500 |
| 2014 | $1,908 | $30,770 | $5,130 | $25,640 |
Source: Public Records
Map
Nearby Homes
- 21700 Uncompahgre Rd
- TBD Lot 3 Uncompahgre Rd
- 69314 Ursa Rd
- 21446 Uncompahgre Rd
- 68671 Vernal Rd
- 22130 6850 Rd Unit 214
- 22130 6850 Rd Unit 213
- 22130 6850 Rd Unit 211
- 22130 6850 Rd Unit 212
- 22130 6850 Rd Unit 215
- 22130 6850 Rd Unit 210-215
- 22130 6850 Rd Unit 210
- 68200 Ute Valley Dr
- 21475 Highway 550
- Lot 50 6840 Rd
- Lot 48 6840 Rd
- Lot 49 6840 Rd
- Lot 43 6840 Rd
- TBD Ute Valley Dr Unit Lot 1
- TBD Ute Valley Dr Unit Lot 2
- 21675 UMcOmpahgre Rd
- 21675 Uncompahgre Rd
- 21613 6915 Ln
- 21532 6915 Ln
- 21640 Uncompahgre Rd
- 21893 Uncompahgre Rd
- 21635 Uncompahgre Rd
- 21610 Uncompahgre Rd
- 21750 Uncompahgre Rd
- 0 Uncomphagre Rd Unit 683115
- 21740 Uncompahgre Rd
- 21632 6915 Ln
- 21580 Uncompahgre Rd
- 21770 Uncompahgre Rd
- 21897 Uncompahgre Rd
- 21907 Uncompahgre Rd
- 69024 Underwoods Ln
- 21957 Uncompahgre Rd
- 69155 Vernal Rd
- Lot 2 Underwoods Ln