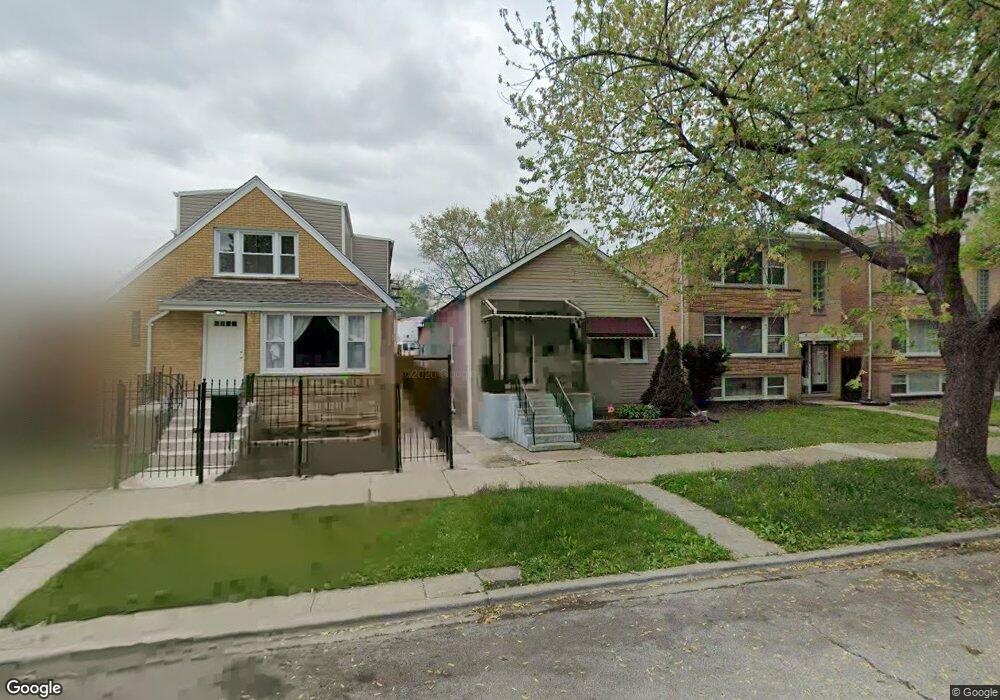
2172 N Mcvicker Ave Chicago, IL 60639
Galewood NeighborhoodEstimated Value: $230,000 - $405,000
2
Beds
2
Baths
1,050
Sq Ft
$292/Sq Ft
Est. Value
About This Home
This home is located at 2172 N Mcvicker Ave, Chicago, IL 60639 and is currently estimated at $306,987, approximately $292 per square foot. 2172 N Mcvicker Ave is a home located in Cook County with nearby schools including Burbank Elementary School, Steinmetz College Prep, and CICS West Belden.
Ownership History
Date
Name
Owned For
Owner Type
Purchase Details
Closed on
Oct 10, 2003
Sold by
Ramos Juan
Bought by
Olayo Martin and Martinez Sebastian
Current Estimated Value
Home Financials for this Owner
Home Financials are based on the most recent Mortgage that was taken out on this home.
Original Mortgage
$228,900
Outstanding Balance
$106,282
Interest Rate
6.49%
Mortgage Type
Unknown
Estimated Equity
$200,705
Purchase Details
Closed on
Mar 4, 2002
Sold by
Ocampo Pedro
Bought by
Ramos Juan and Ramos Gloria
Home Financials for this Owner
Home Financials are based on the most recent Mortgage that was taken out on this home.
Original Mortgage
$186,079
Interest Rate
6.95%
Mortgage Type
FHA
Purchase Details
Closed on
Feb 25, 1999
Sold by
Villasenor Filiberto and Villasenor Magdalena
Bought by
Ocampo Pedro
Home Financials for this Owner
Home Financials are based on the most recent Mortgage that was taken out on this home.
Original Mortgage
$122,811
Interest Rate
6.94%
Mortgage Type
FHA
Create a Home Valuation Report for This Property
The Home Valuation Report is an in-depth analysis detailing your home's value as well as a comparison with similar homes in the area
Home Values in the Area
Average Home Value in this Area
Purchase History
| Date | Buyer | Sale Price | Title Company |
|---|---|---|---|
| Olayo Martin | $236,000 | Heritage Title Co | |
| Ramos Juan | $189,000 | -- | |
| Ocampo Pedro | $123,000 | -- |
Source: Public Records
Mortgage History
| Date | Status | Borrower | Loan Amount |
|---|---|---|---|
| Open | Olayo Martin | $228,900 | |
| Previous Owner | Ramos Juan | $186,079 | |
| Previous Owner | Ocampo Pedro | $122,811 |
Source: Public Records
Tax History
| Year | Tax Paid | Tax Assessment Tax Assessment Total Assessment is a certain percentage of the fair market value that is determined by local assessors to be the total taxable value of land and additions on the property. | Land | Improvement |
|---|---|---|---|---|
| 2025 | $2,889 | $22,001 | $6,938 | $15,063 |
| 2024 | $2,889 | $22,001 | $6,938 | $15,063 |
| 2023 | $2,795 | $17,000 | $5,625 | $11,375 |
| 2022 | $2,795 | $17,000 | $5,625 | $11,375 |
| 2021 | $2,750 | $17,000 | $5,625 | $11,375 |
| 2020 | $3,166 | $17,307 | $4,687 | $12,620 |
| 2019 | $3,220 | $19,447 | $4,687 | $14,760 |
| 2018 | $3,165 | $19,447 | $4,687 | $14,760 |
| 2017 | $3,217 | $18,310 | $4,125 | $14,185 |
| 2016 | $3,169 | $18,310 | $4,125 | $14,185 |
| 2015 | $2,876 | $18,310 | $4,125 | $14,185 |
| 2014 | $2,481 | $15,929 | $3,750 | $12,179 |
| 2013 | $2,421 | $15,929 | $3,750 | $12,179 |
Source: Public Records
Map
Nearby Homes
- 2146 N Mcvicker Ave
- 2240 N Monitor Ave
- 2171 N Mobile Ave
- 2241 N Monitor Ave
- 2117 N Mulligan Ave
- 2135 N Menard Ave
- 2320 N Mulligan Ave
- 2164 N Major Ave
- 2220 N Major Ave
- 2207 N Nagle Ave
- 2341 N Major Ave
- 2601 N Moody Ave
- 2151 N Natchez Ave
- 2159 N Parkside Ave
- 2259 N Natchez Ave
- 2311 N Natchez Ave
- 1742 N Mayfield Ave
- 2630 N Austin Ave
- 2623 N Marmora Ave
- 2531 N Major Ave
- 2174 N Mcvicker Ave
- 2170 N Mcvicker Ave
- 2170 N Mcvicker Ave Unit 1
- 2170 N Mcvicker Ave Unit 2
- 2176 N Mcvicker Ave
- 2176 N Mcvicker Ave
- 2168 N Mcvicker Ave
- 2178 N Mcvicker Ave
- 2166 N Mcvicker Ave
- 2164 N Mcvicker Ave
- 2175 N Meade Ave
- 2179 N Meade Ave
- 2173 N Meade Ave
- 2160 N Mcvicker Ave
- 2171 N Meade Ave
- 2181 N Meade Ave
- 2167 N Meade Ave
- 2203 N Meade Ave
- 2181 N Mcvicker Ave
- 2158 N Mcvicker Ave Unit 2
Your Personal Tour Guide
Ask me questions while you tour the home.