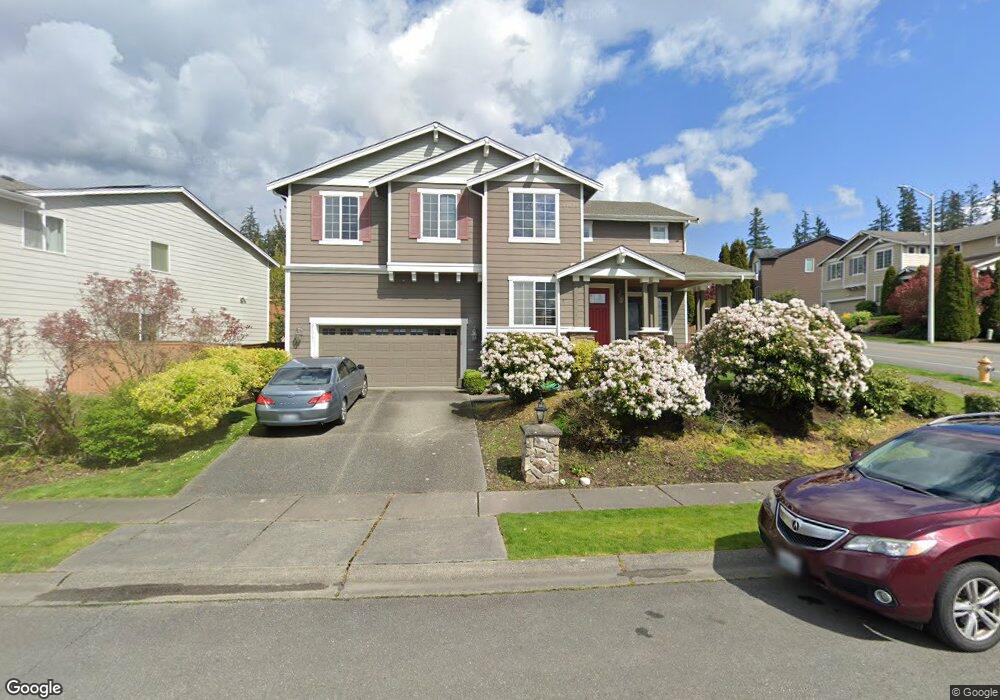
21731 43rd Dr SE Bothell, WA 98021
Canyon Creek NeighborhoodEstimated Value: $1,404,969 - $1,585,000
5
Beds
3
Baths
2,959
Sq Ft
$502/Sq Ft
Est. Value
About This Home
This home is located at 21731 43rd Dr SE, Bothell, WA 98021 and is currently estimated at $1,486,492, approximately $502 per square foot. 21731 43rd Dr SE is a home located in Snohomish County with nearby schools including Kokanee Elementary School, Leota Middle School, and North Creek High School.
Ownership History
Date
Name
Owned For
Owner Type
Purchase Details
Closed on
Aug 2, 2007
Sold by
Schiffner Saul and Schiffner Saul C
Bought by
Ward Terrence S and Ward Teresa D
Current Estimated Value
Home Financials for this Owner
Home Financials are based on the most recent Mortgage that was taken out on this home.
Original Mortgage
$417,000
Outstanding Balance
$256,635
Interest Rate
6.66%
Mortgage Type
Purchase Money Mortgage
Estimated Equity
$1,229,857
Purchase Details
Closed on
Dec 20, 2006
Sold by
Centex Homes
Bought by
Schiffner Saul
Home Financials for this Owner
Home Financials are based on the most recent Mortgage that was taken out on this home.
Original Mortgage
$107,000
Interest Rate
7.87%
Mortgage Type
Stand Alone Second
Create a Home Valuation Report for This Property
The Home Valuation Report is an in-depth analysis detailing your home's value as well as a comparison with similar homes in the area
Home Values in the Area
Average Home Value in this Area
Purchase History
| Date | Buyer | Sale Price | Title Company |
|---|---|---|---|
| Ward Terrence S | $570,000 | The Talon Group | |
| Schiffner Saul | $535,000 | Pnwt |
Source: Public Records
Mortgage History
| Date | Status | Borrower | Loan Amount |
|---|---|---|---|
| Open | Ward Terrence S | $417,000 | |
| Previous Owner | Schiffner Saul | $107,000 | |
| Previous Owner | Schiffner Saul | $428,000 |
Source: Public Records
Tax History
| Year | Tax Paid | Tax Assessment Tax Assessment Total Assessment is a certain percentage of the fair market value that is determined by local assessors to be the total taxable value of land and additions on the property. | Land | Improvement |
|---|---|---|---|---|
| 2026 | $10,878 | $1,369,800 | $855,000 | $514,800 |
| 2025 | $9,936 | $1,216,300 | $715,000 | $501,300 |
| 2024 | $9,936 | $1,110,900 | $627,000 | $483,900 |
| 2023 | $9,831 | $1,225,100 | $725,000 | $500,100 |
| 2022 | $8,778 | $869,500 | $440,000 | $429,500 |
| 2020 | $8,517 | $796,700 | $403,000 | $393,700 |
| 2019 | $7,705 | $729,100 | $320,000 | $409,100 |
| 2018 | $7,319 | $645,000 | $280,000 | $365,000 |
| 2017 | $6,338 | $568,300 | $225,000 | $343,300 |
| 2016 | $6,101 | $533,900 | $205,000 | $328,900 |
| 2015 | $6,189 | $515,000 | $191,000 | $324,000 |
| 2013 | $5,561 | $411,700 | $157,000 | $254,700 |
Source: Public Records
Map
Nearby Homes
- 21927 44th Dr SE
- 4426 216th Place SE
- 4415 220th St SE
- 4219 220th St SE
- 4215 220th St SE
- 4132 220th St SE
- 21417 43rd Dr SE Unit 19
- 4103 220th St SE
- 4118 220th Place SE
- 4026 215th Place SE
- 4001 215th St SE Unit A
- 3928 214th Place SE Unit B
- 3931 221st Place SE
- 3918 214th Place SE Unit A
- 21705 38th Dr SE
- 4214 223rd Place SE
- 22222 49th Ave SE
- 3626 222nd Place SE
- 4215 228th St SE
- 22820 41st Dr SE
- 21727 43rd Dr SE
- 4333 219th St SE
- 21723 43rd Dr SE
- 4326 219th St SE
- 4330 219th St SE
- 4403 219th St SE
- 21728 43rd Dr SE
- 21732 43rd Dr SE
- 21717 43rd Dr SE
- 4411 219th St SE
- 4404 219th St SE
- 21724 43rd Dr SE
- 21902 43rd Dr SE
- 4407 219th St SE
- 21720 43rd Dr SE
- 21907 43rd Dr SE
- 21711 43rd Dr SE
- 21906 43rd Dr SE
- 21920 44th Dr SE
- 4415 219th St SE
Your Personal Tour Guide
Ask me questions while you tour the home.