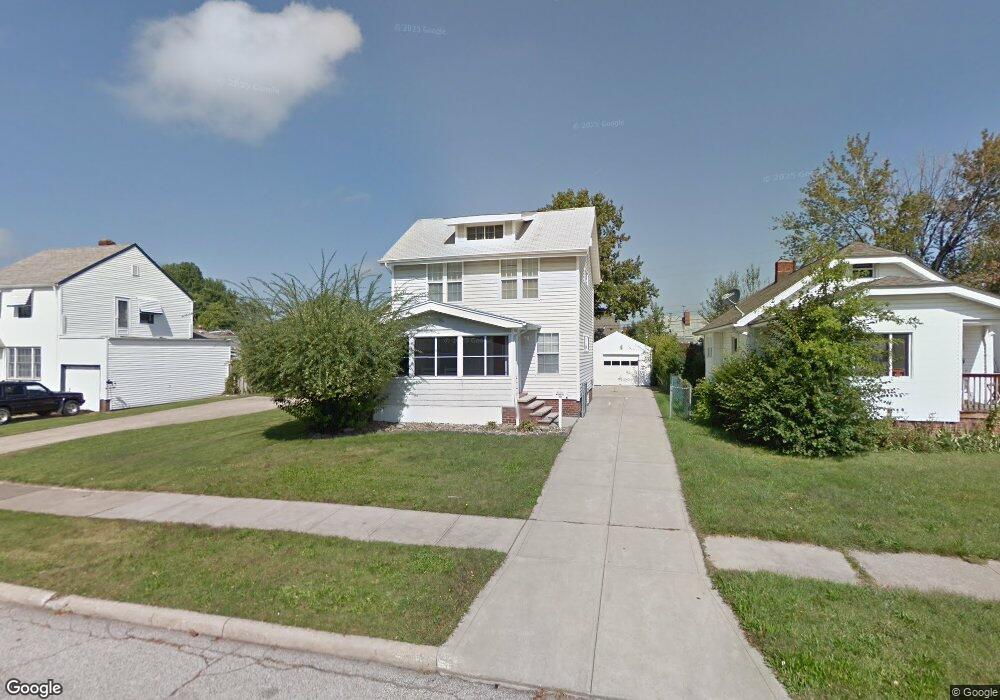
21731 Wilmore Ave Euclid, OH 44123
Estimated Value: $105,870 - $205,000
2
Beds
1
Bath
1,056
Sq Ft
$136/Sq Ft
Est. Value
About This Home
This home is located at 21731 Wilmore Ave, Euclid, OH 44123 and is currently estimated at $143,468, approximately $135 per square foot. 21731 Wilmore Ave is a home located in Cuyahoga County with nearby schools including Arbor Elementary School, Euclid Middle School, and Euclid High School.
Ownership History
Date
Name
Owned For
Owner Type
Purchase Details
Closed on
Aug 23, 2006
Sold by
Yehl Barbara K and Yehl Joseph D
Bought by
Blazetic Renee
Current Estimated Value
Home Financials for this Owner
Home Financials are based on the most recent Mortgage that was taken out on this home.
Original Mortgage
$105,520
Outstanding Balance
$71,583
Interest Rate
9.3%
Mortgage Type
Purchase Money Mortgage
Estimated Equity
$71,885
Purchase Details
Closed on
Aug 31, 1993
Sold by
Bailey Kirk D
Bought by
Bailey Barbara K
Purchase Details
Closed on
Nov 30, 1984
Sold by
Paull John H
Bought by
Bailey Kirk D
Purchase Details
Closed on
Feb 23, 1981
Sold by
Paull John H and Paull Shirley L
Bought by
Paull John H
Purchase Details
Closed on
Jan 1, 1975
Bought by
Paull John H and Paull Shirley L
Create a Home Valuation Report for This Property
The Home Valuation Report is an in-depth analysis detailing your home's value as well as a comparison with similar homes in the area
Home Values in the Area
Average Home Value in this Area
Purchase History
| Date | Buyer | Sale Price | Title Company |
|---|---|---|---|
| Blazetic Renee | $131,900 | Emerald Glen | |
| Bailey Barbara K | -- | -- | |
| Bailey Kirk D | $45,000 | -- | |
| Paull John H | -- | -- | |
| Paull John H | -- | -- |
Source: Public Records
Mortgage History
| Date | Status | Borrower | Loan Amount |
|---|---|---|---|
| Open | Blazetic Renee | $105,520 |
Source: Public Records
Tax History Compared to Growth
Tax History
| Year | Tax Paid | Tax Assessment Tax Assessment Total Assessment is a certain percentage of the fair market value that is determined by local assessors to be the total taxable value of land and additions on the property. | Land | Improvement |
|---|---|---|---|---|
| 2024 | $2,468 | $35,420 | $7,595 | $27,825 |
| 2023 | $2,031 | $23,000 | $5,950 | $17,050 |
| 2022 | $1,986 | $23,000 | $5,950 | $17,050 |
| 2021 | $2,204 | $23,000 | $5,950 | $17,050 |
| 2020 | $1,859 | $17,430 | $4,520 | $12,920 |
| 2019 | $1,667 | $49,800 | $12,900 | $36,900 |
| 2018 | $1,433 | $17,430 | $4,520 | $12,920 |
| 2017 | $1,723 | $14,910 | $3,010 | $11,900 |
| 2016 | $1,727 | $14,910 | $3,010 | $11,900 |
| 2015 | $2,245 | $14,910 | $3,010 | $11,900 |
| 2014 | $2,245 | $14,910 | $3,010 | $11,900 |
Source: Public Records
Map
Nearby Homes
- 21481 Ball Ave
- 21440 Fuller Ave
- 21170 Wilmore Ave
- 21181 Ball Ave
- 21051 Westport Ave
- 21030 Priday Ave
- 22601 Ivan Ave
- 21251 S Lake Shore Blvd
- 20801 Morris Ave
- 20760 Westport Ave
- 21051 S Lake Shore Blvd
- 20830 Tracy Ave
- 22301 Milton Dr
- 20671 Wilmore Ave
- 21130 Arbor Ave
- 362 E 214th St
- 21561 Maydale Ave
- 828 E 216th St
- 22901 Arms Ave
- 20450 Wilmore Ave
- 21701 Wilmore Ave
- 21751 Wilmore Ave
- 21671 Wilmore Ave
- 21730 Westport Ave
- 21651 Wilmore Ave
- 21821 Wilmore Ave
- 21670 Westport Ave
- 21770 Westport Ave
- 21601 Wilmore Ave
- 21851 Wilmore Ave
- 21650 Westport Ave
- 21800 Westport Ave
- 21730 Wilmore Ave
- 21750 Wilmore Ave
- 21700 Wilmore Ave
- 21770 Wilmore Ave
- 21600 Westport Ave
- 21571 Wilmore Ave
- 21850 Westport Ave
- 21871 Wilmore Ave