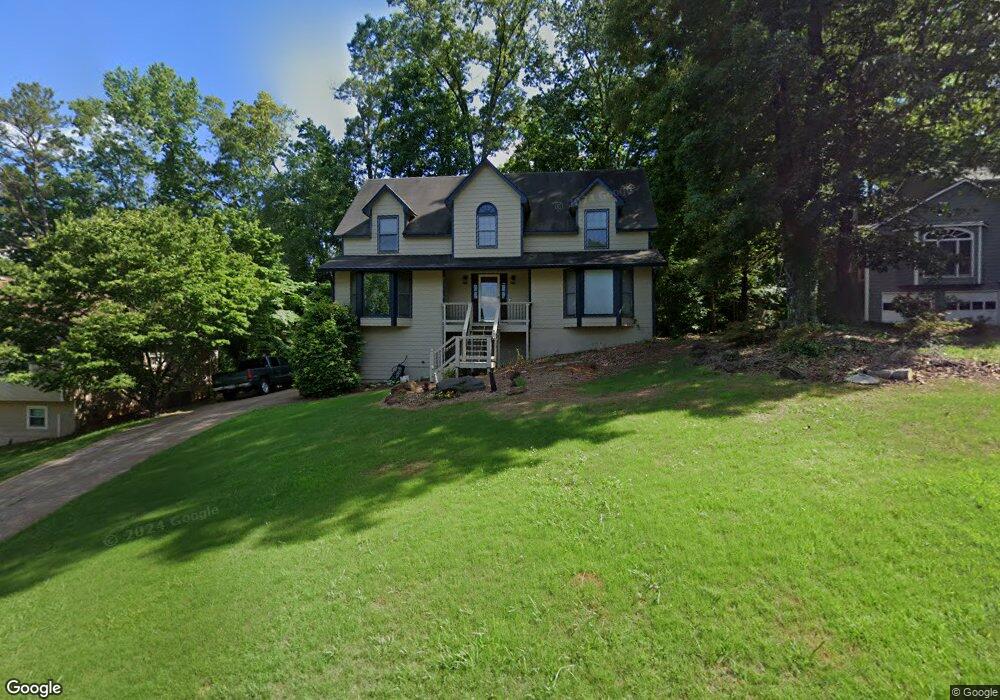
2174 Chartwell Dr Unit 3 Marietta, GA 30066
Sandy Plains NeighborhoodEstimated Value: $438,497 - $530,000
3
Beds
3
Baths
2,243
Sq Ft
$207/Sq Ft
Est. Value
About This Home
This home is located at 2174 Chartwell Dr Unit 3, Marietta, GA 30066 and is currently estimated at $464,874, approximately $207 per square foot. 2174 Chartwell Dr Unit 3 is a home located in Cobb County with nearby schools including Rocky Mount Elementary School, Simpson Middle School, and Lassiter High School.
Ownership History
Date
Name
Owned For
Owner Type
Purchase Details
Closed on
Jan 31, 2002
Sold by
Fox John D and Fox Marni S
Bought by
Harp Henry S and Harp Beverly A
Current Estimated Value
Home Financials for this Owner
Home Financials are based on the most recent Mortgage that was taken out on this home.
Original Mortgage
$168,568
Outstanding Balance
$69,277
Interest Rate
7.12%
Mortgage Type
FHA
Estimated Equity
$395,597
Purchase Details
Closed on
Jun 8, 2000
Sold by
Fox John D
Bought by
Fox John D and Fox Marni S
Home Financials for this Owner
Home Financials are based on the most recent Mortgage that was taken out on this home.
Original Mortgage
$119,925
Interest Rate
8.27%
Mortgage Type
New Conventional
Purchase Details
Closed on
Apr 24, 1997
Sold by
Henderson Thomas L and Wros Marcia S
Bought by
Koran Ola B
Home Financials for this Owner
Home Financials are based on the most recent Mortgage that was taken out on this home.
Original Mortgage
$126,176
Interest Rate
7.95%
Mortgage Type
FHA
Purchase Details
Closed on
Nov 21, 1994
Sold by
Paschal Ann H
Bought by
Henderson Thomas L Marcia
Home Financials for this Owner
Home Financials are based on the most recent Mortgage that was taken out on this home.
Original Mortgage
$107,000
Interest Rate
8.92%
Create a Home Valuation Report for This Property
The Home Valuation Report is an in-depth analysis detailing your home's value as well as a comparison with similar homes in the area
Home Values in the Area
Average Home Value in this Area
Purchase History
| Date | Buyer | Sale Price | Title Company |
|---|---|---|---|
| Harp Henry S | $169,900 | -- | |
| Fox John D | -- | -- | |
| Fox John D | $159,900 | -- | |
| Koran Ola B | $130,000 | -- | |
| Henderson Thomas L Marcia | $125,900 | -- |
Source: Public Records
Mortgage History
| Date | Status | Borrower | Loan Amount |
|---|---|---|---|
| Open | Harp Henry S | $168,568 | |
| Previous Owner | Fox John D | $119,925 | |
| Previous Owner | Koran Ola B | $126,176 | |
| Previous Owner | Henderson Thomas L Marcia | $107,000 |
Source: Public Records
Tax History Compared to Growth
Tax History
| Year | Tax Paid | Tax Assessment Tax Assessment Total Assessment is a certain percentage of the fair market value that is determined by local assessors to be the total taxable value of land and additions on the property. | Land | Improvement |
|---|---|---|---|---|
| 2025 | $4,263 | $178,600 | $44,000 | $134,600 |
| 2024 | $4,267 | $178,600 | $44,000 | $134,600 |
| 2023 | $2,844 | $138,024 | $26,000 | $112,024 |
| 2022 | $3,412 | $138,024 | $26,000 | $112,024 |
| 2021 | $3,158 | $126,396 | $26,000 | $100,396 |
| 2020 | $3,158 | $126,396 | $26,000 | $100,396 |
| 2019 | $2,603 | $101,032 | $26,000 | $75,032 |
| 2018 | $2,603 | $101,032 | $26,000 | $75,032 |
| 2017 | $2,071 | $81,688 | $22,000 | $59,688 |
| 2016 | $2,072 | $81,688 | $22,000 | $59,688 |
| 2015 | $2,231 | $86,468 | $16,000 | $70,468 |
| 2014 | $2,177 | $83,280 | $0 | $0 |
Source: Public Records
Map
Nearby Homes
- 3287 Allegheny Dr
- 3634 Stonehenge Way NE
- 1833 Lake Ebenezer Trail NE
- 1810 Ebenezer Farm Cir
- 3663 Heatherwood Dr NE
- 2011 Shadowwood Dr
- 3170 Ebenezer Rd
- 3328 Knight Rd
- 2403 Wistful Way
- 3835 Rockhaven Ct
- 2415 Wistful Way
- 2477 Bobbie Dr
- 1984 Credence Ct NE
- 3812 Havenrock Dr
- 3851 Trickum Rd NE
- 3122 Vandiver Dr
- 3816 Havenrock Dr
- 3150 Trickum Rd NE Unit LOT 1
- 3150 Trickum Rd NE
- 2176 Chartwell Dr
- 2172 Chartwell Dr
- 2172 Chartwell Dr Unit 2172
- 2172 Chartwell Dr Unit 3
- 3435 Ranch Rd
- 2178 Chartwell Dr
- 2170 Chartwell Dr
- 3570 Downing St Unit 3
- 3569 Downing St
- 3295 Allegheny Dr
- 3421 Ranch Rd
- 2171 Chartwell Dr Unit 3
- 3571 Downing St
- 2180 Chartwell Dr
- 3572 Downing St
- 3297 Allegheny Dr
- 1972 Chartwell Ct
- 3293 Allegheny Dr Unit 2
- 3440 Ranch Rd
- 1971 Chartwell Ct