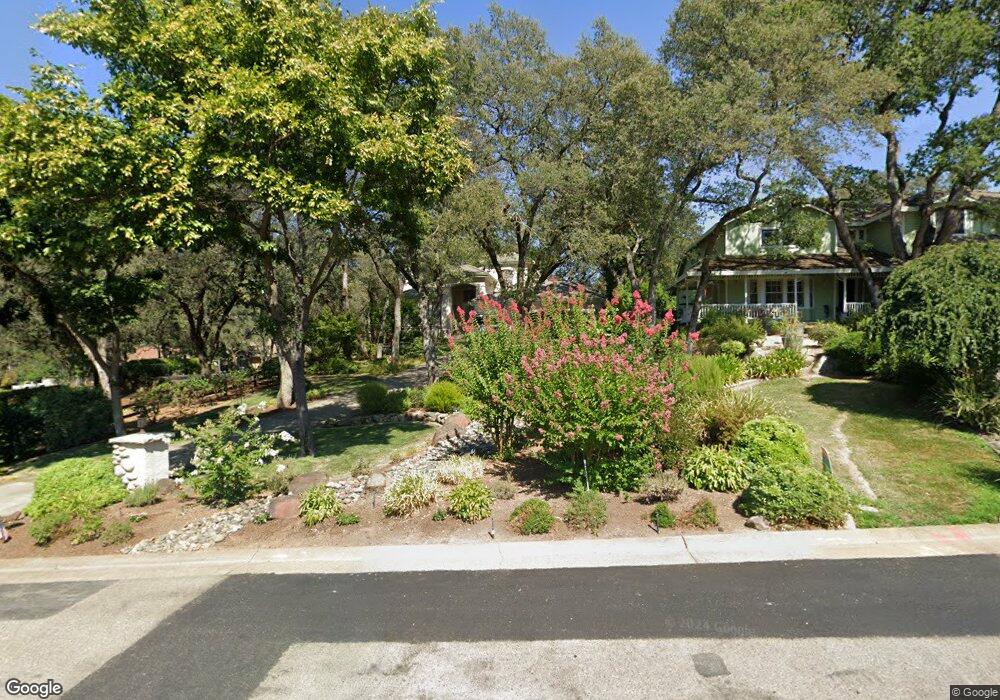
2174 Moonstone Cir El Dorado Hills, CA 95762
Ridgeview Village NeighborhoodEstimated Value: $822,000 - $858,000
4
Beds
3
Baths
2,683
Sq Ft
$311/Sq Ft
Est. Value
About This Home
This home is located at 2174 Moonstone Cir, El Dorado Hills, CA 95762 and is currently estimated at $835,081, approximately $311 per square foot. 2174 Moonstone Cir is a home located in El Dorado County with nearby schools including Silva Valley Elementary School, Rolling Hills Middle School, and Oak Ridge High School.
Ownership History
Date
Name
Owned For
Owner Type
Purchase Details
Closed on
Aug 26, 2019
Sold by
Pifer Fredrick L and Pifer Audrey S
Bought by
Pifer Fredrick Leroy and Pifer Audrey Suzanne
Current Estimated Value
Home Financials for this Owner
Home Financials are based on the most recent Mortgage that was taken out on this home.
Original Mortgage
$187,000
Outstanding Balance
$163,797
Interest Rate
3.6%
Mortgage Type
VA
Estimated Equity
$671,284
Purchase Details
Closed on
Feb 7, 2018
Sold by
Pifer Fredrick Lroy and Pifer Audrey S
Bought by
Pifer Fredrick L and Pifer Audrey S
Purchase Details
Closed on
Jun 2, 1995
Sold by
Skarlatos George and Skarlatos Candace C
Bought by
Pifer Fredrick Leroy and Pifer Audrey Suzanne
Home Financials for this Owner
Home Financials are based on the most recent Mortgage that was taken out on this home.
Original Mortgage
$169,000
Interest Rate
8.36%
Create a Home Valuation Report for This Property
The Home Valuation Report is an in-depth analysis detailing your home's value as well as a comparison with similar homes in the area
Home Values in the Area
Average Home Value in this Area
Purchase History
| Date | Buyer | Sale Price | Title Company |
|---|---|---|---|
| Pifer Fredrick Leroy | -- | Fidelity National Title | |
| Pifer Fredrick L | -- | None Available | |
| Pifer Fredrick Leroy | $294,000 | Placer Title Company |
Source: Public Records
Mortgage History
| Date | Status | Borrower | Loan Amount |
|---|---|---|---|
| Open | Pifer Fredrick Leroy | $187,000 | |
| Closed | Pifer Fredrick Leroy | $169,000 |
Source: Public Records
Tax History Compared to Growth
Tax History
| Year | Tax Paid | Tax Assessment Tax Assessment Total Assessment is a certain percentage of the fair market value that is determined by local assessors to be the total taxable value of land and additions on the property. | Land | Improvement |
|---|---|---|---|---|
| 2025 | $5,130 | $493,794 | $125,958 | $367,836 |
| 2024 | $5,130 | $484,113 | $123,489 | $360,624 |
| 2023 | $5,003 | $474,621 | $121,068 | $353,553 |
| 2022 | $4,957 | $465,316 | $118,695 | $346,621 |
| 2021 | $4,888 | $456,193 | $116,368 | $339,825 |
| 2020 | $4,824 | $451,516 | $115,175 | $336,341 |
| 2019 | $4,748 | $442,664 | $112,917 | $329,747 |
| 2018 | $4,586 | $433,985 | $110,703 | $323,282 |
| 2017 | $4,506 | $425,477 | $108,533 | $316,944 |
| 2016 | $4,444 | $417,135 | $106,405 | $310,730 |
| 2015 | $4,324 | $410,870 | $104,807 | $306,063 |
| 2014 | $4,324 | $402,824 | $102,755 | $300,069 |
Source: Public Records
Map
Nearby Homes
- 3789 Pardee Ct
- 3354 Adam Ct
- 3058 Ridgeview Dr
- 3178 Ridgeview Dr
- 3452 Tah Nee Way
- 265 Muse Dr
- 1999 Shelby Cir
- 3870 Meadow Wood Dr
- LOT 2 Julie Ann Way
- 47 Powers Dr
- 2595 Capetanios Dr
- 3197 Warren Ln
- 2581 Capetanios Dr
- 326 Endless Ct
- 0 Capetanios Dr Unit 222109547
- 424 Powers Dr
- 4165 Brisbane Cir
- 436 Powers Dr
- Plan 2 at Ridgeview
- 3226 Beatty Dr
- 2168 Moonstone Cir
- 2160 Moonstone Cir
- 3188 Latham Ln
- 2175 Moonstone Cir
- 3196 Latham Ln
- 2181 Moonstone Cir
- 2165 Moonstone Cir
- 2919 Ridgeview Dr
- 3180 Latham Ln
- 2939 Ridgeview Dr
- 2153 Moonstone Cir
- 2152 Moonstone Cir
- 2915 Ridgeview Dr
- 3172 Latham Ln
- 1184 Turquoise Way
- 2943 Ridgeview Dr
- 2924 Ridgeview Dr
- 2932 Ridgeview Dr
- 1177 Turquoise Way
- 2141 Moonstone Cir