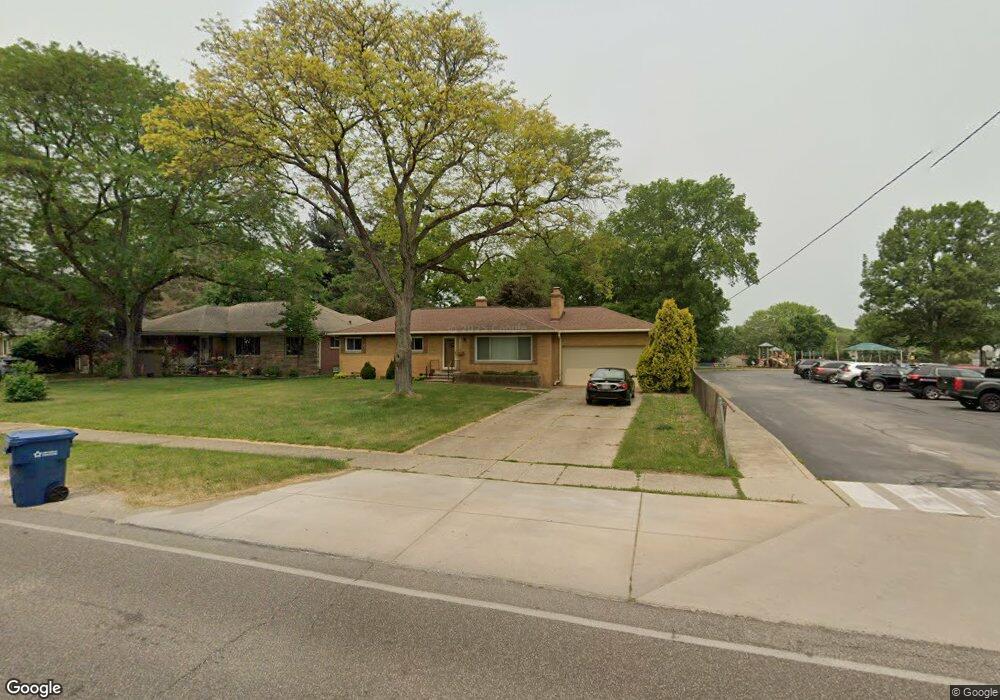
21740 Mastick Rd Cleveland, OH 44126
Estimated Value: $254,087 - $287,000
3
Beds
2
Baths
1,296
Sq Ft
$212/Sq Ft
Est. Value
About This Home
This home is located at 21740 Mastick Rd, Cleveland, OH 44126 and is currently estimated at $275,272, approximately $212 per square foot. 21740 Mastick Rd is a home located in Cuyahoga County with nearby schools including Gilles-Sweet Elementary School, Lewis F Mayer Middle School, and Fairview High School.
Ownership History
Date
Name
Owned For
Owner Type
Purchase Details
Closed on
Oct 1, 2021
Sold by
Helwig Jerry K
Bought by
Lozier Robert A and Lozier Lori A
Current Estimated Value
Home Financials for this Owner
Home Financials are based on the most recent Mortgage that was taken out on this home.
Original Mortgage
$113,200
Outstanding Balance
$103,228
Interest Rate
2.8%
Mortgage Type
New Conventional
Estimated Equity
$172,044
Purchase Details
Closed on
Apr 26, 2000
Sold by
Halek Kenneth L and Halek Mary Ellen
Bought by
Helwig Jerry K
Purchase Details
Closed on
Aug 14, 1990
Sold by
Clark Lillian
Bought by
Halek Kenneth L
Purchase Details
Closed on
Apr 24, 1990
Sold by
Clark L A and Minerd W A
Bought by
Clark Lillian
Purchase Details
Closed on
Feb 25, 1981
Sold by
Minerd Wilbert A and Minerd Lillian
Bought by
Clark L A and Clark Minerd W
Purchase Details
Closed on
Jan 1, 1975
Bought by
Minerd Wilbert A and Minerd Lillian
Create a Home Valuation Report for This Property
The Home Valuation Report is an in-depth analysis detailing your home's value as well as a comparison with similar homes in the area
Home Values in the Area
Average Home Value in this Area
Purchase History
| Date | Buyer | Sale Price | Title Company |
|---|---|---|---|
| Lozier Robert A | $153,200 | Maximum Title | |
| Helwig Jerry K | $128,000 | Chicago Title Insurance Comp | |
| Halek Kenneth L | $95,000 | -- | |
| Clark Lillian | -- | -- | |
| Clark L A | -- | -- | |
| Minerd Wilbert A | -- | -- |
Source: Public Records
Mortgage History
| Date | Status | Borrower | Loan Amount |
|---|---|---|---|
| Open | Lozier Robert A | $113,200 |
Source: Public Records
Tax History Compared to Growth
Tax History
| Year | Tax Paid | Tax Assessment Tax Assessment Total Assessment is a certain percentage of the fair market value that is determined by local assessors to be the total taxable value of land and additions on the property. | Land | Improvement |
|---|---|---|---|---|
| 2024 | $5,648 | $81,970 | $18,060 | $63,910 |
| 2023 | $5,351 | $66,500 | $13,510 | $52,990 |
| 2022 | $5,218 | $66,500 | $13,510 | $52,990 |
| 2021 | $5,329 | $66,500 | $13,510 | $52,990 |
| 2020 | $4,902 | $53,620 | $10,890 | $42,740 |
| 2019 | $4,358 | $153,200 | $31,100 | $122,100 |
| 2018 | $2,181 | $53,620 | $10,890 | $42,740 |
| 2017 | $3,931 | $44,600 | $10,960 | $33,640 |
| 2016 | $3,905 | $44,600 | $10,960 | $33,640 |
| 2015 | $3,763 | $44,600 | $10,960 | $33,640 |
| 2014 | $3,763 | $43,300 | $10,640 | $32,660 |
Source: Public Records
Map
Nearby Homes
- 5300 Sherwood Dr
- 22276 Sycamore Dr
- 22250 Mastick Rd
- 22439 Haber Dr
- 22534 Bard Ave
- 22537 Lenox Dr
- 21104 Mastick Rd
- 21877 Seabury Ave
- 22640 Lenox Dr
- 22636 Mastick Rd
- 22503 Sandy Ln
- 22831 Esther Ave
- 20930 Mastick Rd
- 22934 Mastick Rd Unit 102
- 21888 Eaton Rd
- 22895 Mastick Rd
- 4480 W 224th St
- 4654 W 221st St
- 4464 W 224th St
- 4627 W 223rd St
- 21768 Mastick Rd
- 21790 Mastick Rd
- 21771 Mastick Rd
- 21812 Mastick Rd
- 21757 Mastick Rd
- 21735 Mastick Rd
- 21820 Mastick Rd
- 21685 Mastick Rd
- 21805 Mastick Rd
- 21815 Mastick Rd
- 21665 Mastick Rd
- 21830 Mastick Rd
- 21831 Mastick Rd
- 21801 Mastick Rd
- 21856 Mastick Rd
- 21655 Riviera Dr
- 21801 Sherwood Dr
- 21821 Sherwood Dr
- 21781 Sherwood Dr
- 21841 Sherwood Dr