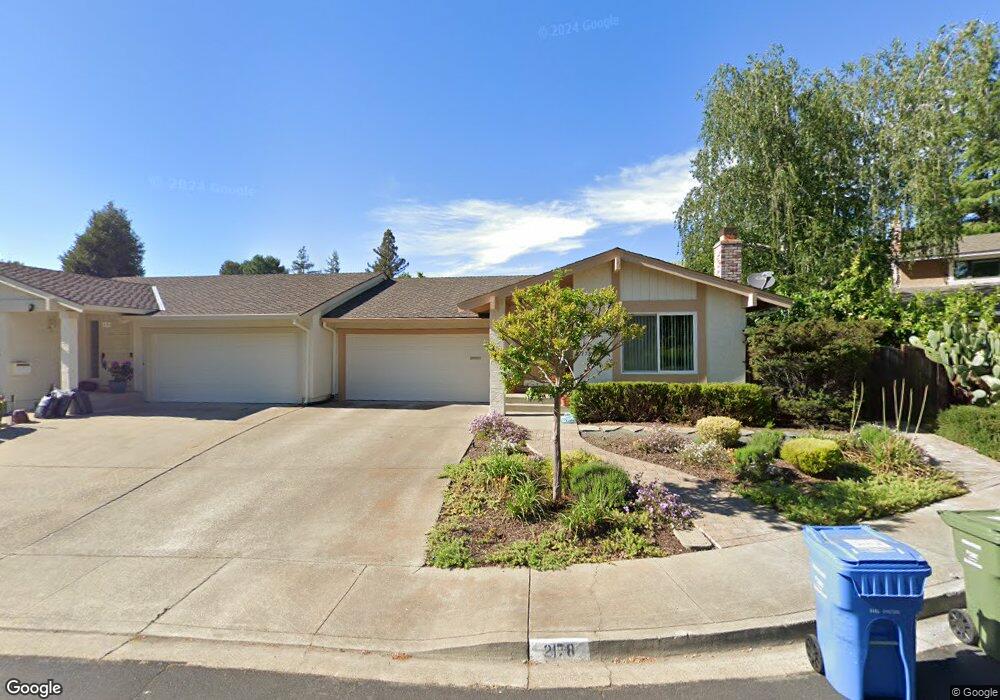
2176 Londonderry Ct Walnut Creek, CA 94596
Estimated Value: $1,041,000 - $1,217,000
3
Beds
2
Baths
1,628
Sq Ft
$691/Sq Ft
Est. Value
About This Home
This home is located at 2176 Londonderry Ct, Walnut Creek, CA 94596 and is currently estimated at $1,124,912, approximately $690 per square foot. 2176 Londonderry Ct is a home located in Contra Costa County with nearby schools including Murwood Elementary School, Walnut Creek Intermediate School, and Las Lomas High School.
Ownership History
Date
Name
Owned For
Owner Type
Purchase Details
Closed on
Dec 11, 2020
Sold by
Sharon L Santos Living Trust and Santos Sharon L
Bought by
Santos Shari L
Current Estimated Value
Home Financials for this Owner
Home Financials are based on the most recent Mortgage that was taken out on this home.
Original Mortgage
$205,000
Outstanding Balance
$148,809
Interest Rate
2.7%
Mortgage Type
New Conventional
Estimated Equity
$976,103
Purchase Details
Closed on
Dec 4, 2020
Sold by
Santos Shari L
Bought by
Santos Sharon L and Sharon L Santos Living Trust
Home Financials for this Owner
Home Financials are based on the most recent Mortgage that was taken out on this home.
Original Mortgage
$205,000
Outstanding Balance
$148,809
Interest Rate
2.7%
Mortgage Type
New Conventional
Estimated Equity
$976,103
Purchase Details
Closed on
Jan 10, 2018
Sold by
Santos Sharon L
Bought by
Santos Sharon L
Purchase Details
Closed on
Oct 10, 2016
Sold by
Santos Sharon L and Santos Shari L
Bought by
Santos Sharon L
Home Financials for this Owner
Home Financials are based on the most recent Mortgage that was taken out on this home.
Original Mortgage
$250,000
Interest Rate
3.46%
Mortgage Type
New Conventional
Purchase Details
Closed on
Jun 19, 2002
Sold by
Sullivan Laura L
Bought by
Santos Shari L
Home Financials for this Owner
Home Financials are based on the most recent Mortgage that was taken out on this home.
Original Mortgage
$194,000
Interest Rate
6.86%
Mortgage Type
Unknown
Purchase Details
Closed on
Mar 6, 1998
Sold by
Sullivan Laura L
Bought by
Sullivan Laura L
Home Financials for this Owner
Home Financials are based on the most recent Mortgage that was taken out on this home.
Original Mortgage
$104,000
Interest Rate
7.11%
Mortgage Type
Purchase Money Mortgage
Purchase Details
Closed on
Jun 24, 1996
Sold by
Reinke Richard C and Reinke Helen L
Bought by
Sullivan Laura L
Home Financials for this Owner
Home Financials are based on the most recent Mortgage that was taken out on this home.
Original Mortgage
$126,500
Interest Rate
8.09%
Mortgage Type
Purchase Money Mortgage
Purchase Details
Closed on
Jun 4, 1996
Sold by
Sullivan Peter E
Bought by
Sullivan Laura L
Home Financials for this Owner
Home Financials are based on the most recent Mortgage that was taken out on this home.
Original Mortgage
$126,500
Interest Rate
8.09%
Mortgage Type
Purchase Money Mortgage
Create a Home Valuation Report for This Property
The Home Valuation Report is an in-depth analysis detailing your home's value as well as a comparison with similar homes in the area
Home Values in the Area
Average Home Value in this Area
Purchase History
| Date | Buyer | Sale Price | Title Company |
|---|---|---|---|
| Santos Shari L | -- | Stewart Title | |
| Santos Sharon L | -- | Stewart Title Of Ca Inc | |
| Santos Shari L | -- | Stewart Title Of Ca Inc | |
| Santos Sharon L | -- | None Available | |
| Santos Sharon L | -- | North American Title Co Inc | |
| Santos Shari L | $458,000 | Old Republic Title Company | |
| Sullivan Laura L | -- | First American Title Guarant | |
| Sullivan Laura L | $236,500 | Fidelity National Title Co | |
| Sullivan Laura L | -- | Fidelity National Title Co |
Source: Public Records
Mortgage History
| Date | Status | Borrower | Loan Amount |
|---|---|---|---|
| Open | Santos Shari L | $205,000 | |
| Closed | Santos Shari L | $205,000 | |
| Previous Owner | Santos Sharon L | $250,000 | |
| Previous Owner | Santos Shari L | $194,000 | |
| Previous Owner | Sullivan Laura L | $104,000 | |
| Previous Owner | Sullivan Laura L | $126,500 |
Source: Public Records
Tax History Compared to Growth
Tax History
| Year | Tax Paid | Tax Assessment Tax Assessment Total Assessment is a certain percentage of the fair market value that is determined by local assessors to be the total taxable value of land and additions on the property. | Land | Improvement |
|---|---|---|---|---|
| 2025 | $8,010 | $676,578 | $413,634 | $262,944 |
| 2024 | $8,192 | $663,313 | $405,524 | $257,789 |
| 2023 | $8,192 | $650,308 | $397,573 | $252,735 |
| 2022 | $8,018 | $637,558 | $389,778 | $247,780 |
| 2021 | $7,800 | $625,058 | $382,136 | $242,922 |
| 2019 | $7,625 | $606,520 | $370,802 | $235,718 |
| 2018 | $7,368 | $594,629 | $363,532 | $231,097 |
| 2017 | $7,225 | $582,970 | $356,404 | $226,566 |
| 2016 | $7,083 | $571,540 | $349,416 | $222,124 |
| 2015 | $6,917 | $562,956 | $344,168 | $218,788 |
| 2014 | $6,829 | $551,930 | $337,427 | $214,503 |
Source: Public Records
Map
Nearby Homes
- 1092 Hillendale Ct
- 2409 Lavender Dr
- 1555 Pebblebrook Ct
- 1305 Chesterton Way
- 31 Arabian Ct
- 716 Rosewood Dr
- 1096 Mountain View Blvd
- 32 Pacer Place
- 2673 Velvet Way
- 721 Fair Oaks Dr
- 421 Twin Oaks Ln
- 420 Livorna Rd
- 47 Kentfield Ct
- 2129 Youngs Ct
- 234 Acacia Ln
- 125 Mystic Place
- 628 Sugarloaf Ct
- 210 Likely Dr
- 172 Rudgear Dr
- 77 Pleasant Knoll Ct
- 2162 Londonderry Ct
- 2178 Londonderry Ct
- 2099 Robb Rd
- 2097 Robb Rd
- 2160 Londonderry Ct
- 2095 Robb Rd
- 2180 Londonderry Ct
- 2093 Robb Rd
- 2182 Londonderry Ct
- 2148 Londonderry Ct
- 2091 Robb Rd
- 2194 Londonderry Ct
- 2196 Londonderry Ct
- 2146 Londonderry Ct
- 2089 Robb Rd
- 2149 Londonderry Ct
- 2096 Robb Rd
- 2094 Robb Rd
- 2090 Robb Rd
- 2132 Londonderry Ct