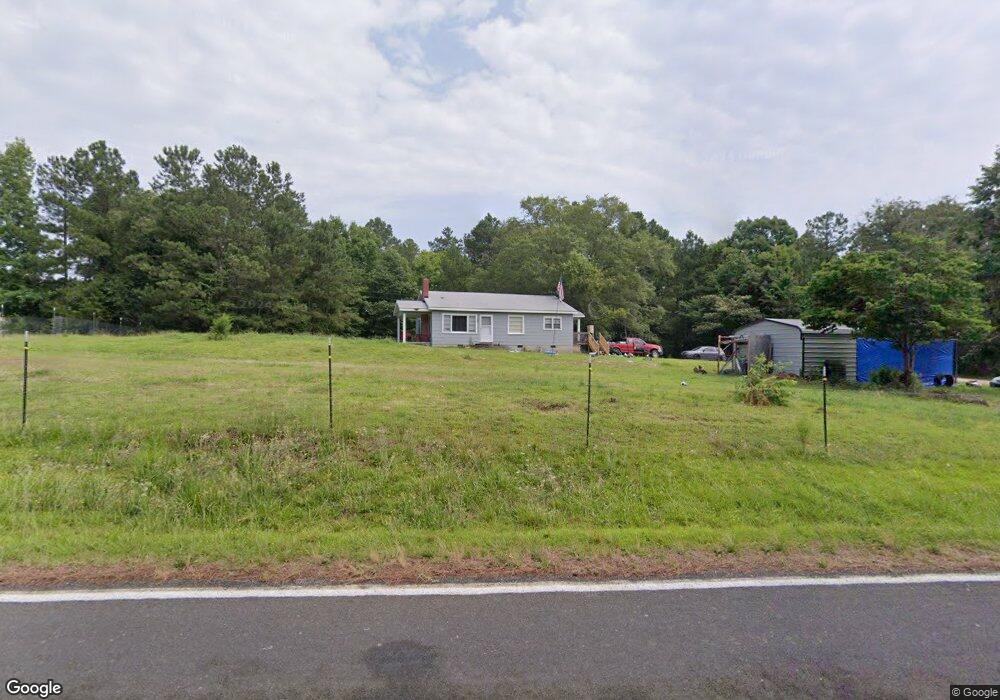
2177 Flint Ridge Rd Heath Springs, SC 29058
Estimated Value: $100,000 - $225,000
--
Bed
1
Bath
1,131
Sq Ft
$133/Sq Ft
Est. Value
About This Home
This home is located at 2177 Flint Ridge Rd, Heath Springs, SC 29058 and is currently estimated at $150,560, approximately $133 per square foot. 2177 Flint Ridge Rd is a home located in Lancaster County with nearby schools including Kershaw Elementary School, Andrew Jackson Middle School, and Andrew Jackson High School.
Ownership History
Date
Name
Owned For
Owner Type
Purchase Details
Closed on
Mar 5, 2021
Sold by
Mcmanus Tommy E and Mcmanus Michelle R
Bought by
Faulkenberry Justin Lane
Current Estimated Value
Home Financials for this Owner
Home Financials are based on the most recent Mortgage that was taken out on this home.
Original Mortgage
$65,400
Outstanding Balance
$60,457
Interest Rate
4.75%
Mortgage Type
New Conventional
Estimated Equity
$90,103
Purchase Details
Closed on
Nov 12, 2018
Sold by
Mcmanus Tommy E and Mcmanus Michelle R
Bought by
Barlow Larry Christopher
Purchase Details
Closed on
Apr 23, 2018
Sold by
Pitts Henry Lewis
Bought by
Mcmanus Tommy E and Mcmanus Michelle R
Purchase Details
Closed on
Dec 12, 2011
Sold by
Pitts Henry Lewis
Bought by
Pitts Woodrow T
Purchase Details
Closed on
Jun 17, 2010
Sold by
Pitts Woodrow T and Stover Audrey M Duncan
Bought by
Pitts Henry Lewis
Purchase Details
Closed on
Apr 22, 2010
Sold by
Pitts Audrey
Bought by
Pitts Woodrow T
Create a Home Valuation Report for This Property
The Home Valuation Report is an in-depth analysis detailing your home's value as well as a comparison with similar homes in the area
Home Values in the Area
Average Home Value in this Area
Purchase History
| Date | Buyer | Sale Price | Title Company |
|---|---|---|---|
| Faulkenberry Justin Lane | $66,500 | None Available | |
| Barlow Larry Christopher | -- | None Available | |
| Mcmanus Tommy E | $37,000 | None Available | |
| Pitts Woodrow T | -- | -- | |
| Pitts Henry Lewis | -- | -- | |
| Pitts Woodrow T | -- | -- |
Source: Public Records
Mortgage History
| Date | Status | Borrower | Loan Amount |
|---|---|---|---|
| Open | Faulkenberry Justin Lane | $65,400 |
Source: Public Records
Tax History Compared to Growth
Tax History
| Year | Tax Paid | Tax Assessment Tax Assessment Total Assessment is a certain percentage of the fair market value that is determined by local assessors to be the total taxable value of land and additions on the property. | Land | Improvement |
|---|---|---|---|---|
| 2024 | $396 | $2,584 | $668 | $1,916 |
| 2023 | $394 | $2,584 | $668 | $1,916 |
| 2022 | $393 | $2,584 | $668 | $1,916 |
| 2021 | $352 | $2,356 | $668 | $1,688 |
| 2020 | $1,027 | $3,168 | $1,014 | $2,154 |
| 2019 | $1,156 | $3,420 | $1,266 | $2,154 |
| 2018 | $1,123 | $3,450 | $1,296 | $2,154 |
| 2017 | $45 | $0 | $0 | $0 |
| 2016 | $44 | $0 | $0 | $0 |
| 2015 | $44 | $0 | $0 | $0 |
| 2014 | $44 | $0 | $0 | $0 |
| 2013 | $44 | $0 | $0 | $0 |
Source: Public Records
Map
Nearby Homes
- 000 Spirit Rd
- 43 Spirit Rd
- 000 Fork Hill Rd
- 4368 Rob Neal Rd
- 4562 Foster Blackmon Dr
- 5949 Flat Creek Rd
- 12.85 Acres Flat Creek Rd
- 325 Flint Ridge Rd
- 310 East St
- 5486 Kershaw Camden Hwy
- 6963 Kershaw Camden Hwy
- 4462 Flat Creek Rd
- 204 Rowland Ave
- TBD S Main
- 223 W Hammond St
- 1107 E Doc Garris Rd
- 4409 Pleasant Rd
- 7630 Kershaw Camden Hwy
- 6401 N Matson St
- 6504 Day St
- 2195 Flint Ridge Rd
- 2151 Flint Ridge Rd
- 2109 Flint Ridge Rd
- 2249 Flint Ridge Rd
- 2120 Flint Ridge Rd
- 2052 Flint Ridge Rd
- 4021 Spirit Rd
- 3957 Spirit Rd
- 3933 Spirit Rd
- 2055 Flint Ridge Rd
- 0 Hwy 511 Hwy Unit CAR3838081
- 2045 State Road S-29-511
- 2045 Flint Ridge Rd
- 4046 Spirit Rd
- 4352 Sam Blackmon Rd
- 4359 Sam Blackmon Rd
- 4107 Maranda Ln
- 2045 Spirit Rd
- 00 Maranda Ln
- 3854 Spirit Rd