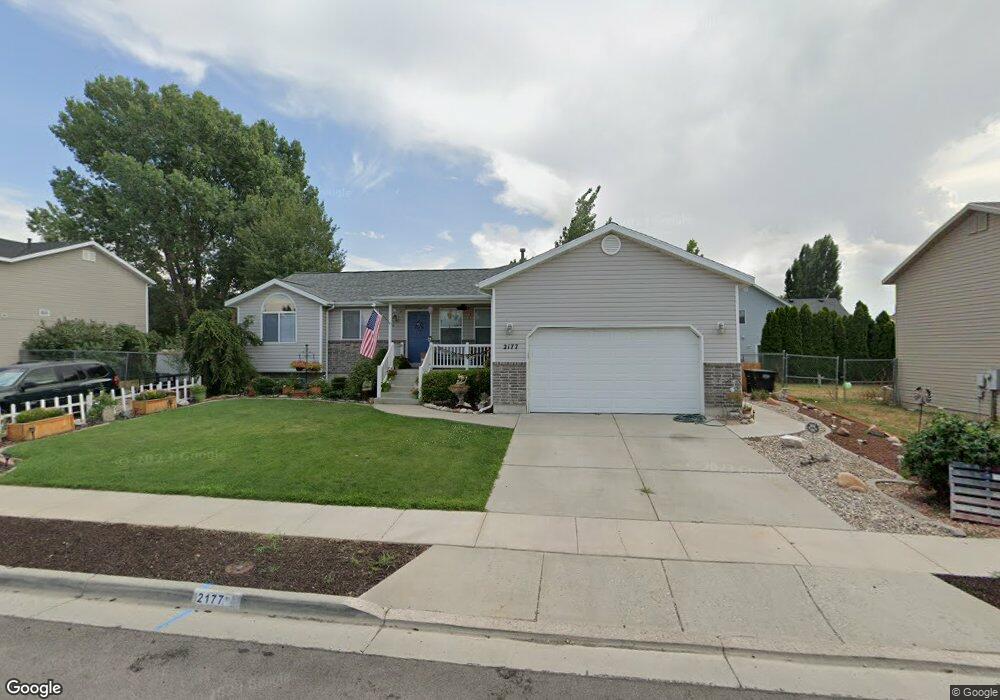
2177 W 2220 N Unit 21 Clearfield, UT 84015
Estimated Value: $417,000 - $472,000
3
Beds
2
Baths
1,499
Sq Ft
$300/Sq Ft
Est. Value
About This Home
This home is located at 2177 W 2220 N Unit 21, Clearfield, UT 84015 and is currently estimated at $450,360, approximately $300 per square foot. 2177 W 2220 N Unit 21 is a home located in Davis County with nearby schools including Parkside Elementary School, West Point Junior High School, and Clearfield High School.
Ownership History
Date
Name
Owned For
Owner Type
Purchase Details
Closed on
Aug 12, 2021
Sold by
Anderson Darrell O
Bought by
Anderson Darrell O and Anderson Debra
Current Estimated Value
Home Financials for this Owner
Home Financials are based on the most recent Mortgage that was taken out on this home.
Original Mortgage
$265,000
Outstanding Balance
$240,077
Interest Rate
2.8%
Mortgage Type
New Conventional
Estimated Equity
$210,283
Purchase Details
Closed on
Jul 20, 2004
Sold by
Mike Schultz Construction Inc
Bought by
Anderson Darrell O
Home Financials for this Owner
Home Financials are based on the most recent Mortgage that was taken out on this home.
Original Mortgage
$169,658
Interest Rate
6.27%
Mortgage Type
VA
Purchase Details
Closed on
Aug 6, 2003
Sold by
River Island Llc
Bought by
Mike Schultz Construction Inc
Create a Home Valuation Report for This Property
The Home Valuation Report is an in-depth analysis detailing your home's value as well as a comparison with similar homes in the area
Home Values in the Area
Average Home Value in this Area
Purchase History
| Date | Buyer | Sale Price | Title Company |
|---|---|---|---|
| Anderson Darrell O | -- | Timios Inc | |
| Anderson Darrell O | -- | Heritage West Title Ins | |
| Mike Schultz Construction Inc | -- | First American Title Co |
Source: Public Records
Mortgage History
| Date | Status | Borrower | Loan Amount |
|---|---|---|---|
| Open | Anderson Darrell O | $265,000 | |
| Closed | Anderson Darrell O | $169,658 |
Source: Public Records
Tax History Compared to Growth
Tax History
| Year | Tax Paid | Tax Assessment Tax Assessment Total Assessment is a certain percentage of the fair market value that is determined by local assessors to be the total taxable value of land and additions on the property. | Land | Improvement |
|---|---|---|---|---|
| 2025 | $2,625 | $252,451 | $83,254 | $169,197 |
| 2024 | $2,635 | $254,650 | $92,218 | $162,432 |
| 2023 | $2,438 | $436,000 | $103,688 | $332,312 |
| 2022 | $2,635 | $260,700 | $64,945 | $195,755 |
| 2021 | $2,351 | $345,000 | $78,745 | $266,255 |
| 2020 | $2,045 | $297,000 | $65,591 | $231,409 |
| 2019 | $1,980 | $281,000 | $79,110 | $201,890 |
| 2018 | $1,843 | $257,000 | $67,146 | $189,854 |
| 2016 | $1,624 | $116,875 | $25,103 | $91,772 |
| 2015 | $1,608 | $110,055 | $25,103 | $84,952 |
| 2014 | $1,508 | $104,858 | $25,103 | $79,755 |
| 2013 | -- | $97,124 | $25,568 | $71,556 |
Source: Public Records
Map
Nearby Homes
- 2164 W 2265 N
- 2083 W 2220 N
- 2162 N 2290 W
- 2616 N 2125 W Unit 147
- 2184 N 2000 W
- 2377 W 2120 N
- 2434 W 2250 N
- Harvard Plan at Summerfield - Enclave
- 2208 W 2615 N
- Linden Plan at Summerfield - Vista
- Yale Plan at Summerfield - Enclave
- Gambel Oak Plan at Summerfield - Vista
- Cedar Plan at Summerfield - Vista
- Elm Plan at Summerfield - Vista
- Princeton Plan at Summerfield - Enclave
- Cambridge Plan at Summerfield - Enclave
- Cornell Plan at Summerfield - Enclave
- Sycamore Plan at Summerfield - Vista
- Berkeley Plan at Summerfield - Enclave
- Birch Plan at Summerfield - Vista
- 2177 W 2220 N
- 2159 W 2220 N
- 2176 W 2175 N
- 2176 W 2175 N Unit 32
- 2191 W 2220 N
- 2191 W 2220 N Unit 22
- 2192 W 2175 N
- 2192 W 2175 N Unit 31
- 2168 W 2175 N
- 2168 W 2175 N Unit 33
- 2174 W 2220 N
- 2188 W 2220 N
- 2147 W 2220 N
- 2188 N 2225 W
- 2194 N 2225 W
- 2156 W 2220 N
- 2154 W 2175 N Unit 34
- 2202 W 2220 N
- 2179 W 2175 N
- 2179 W 2175 N Unit 47