
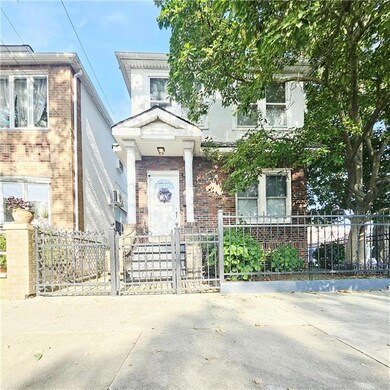
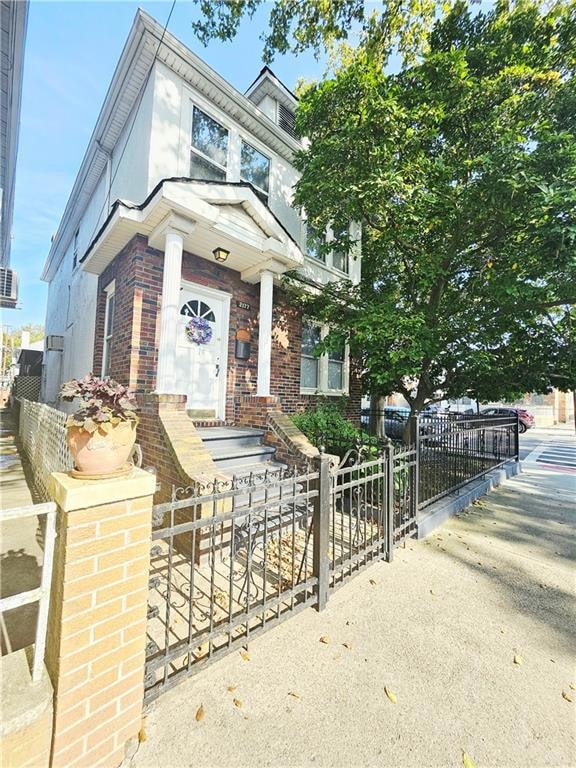
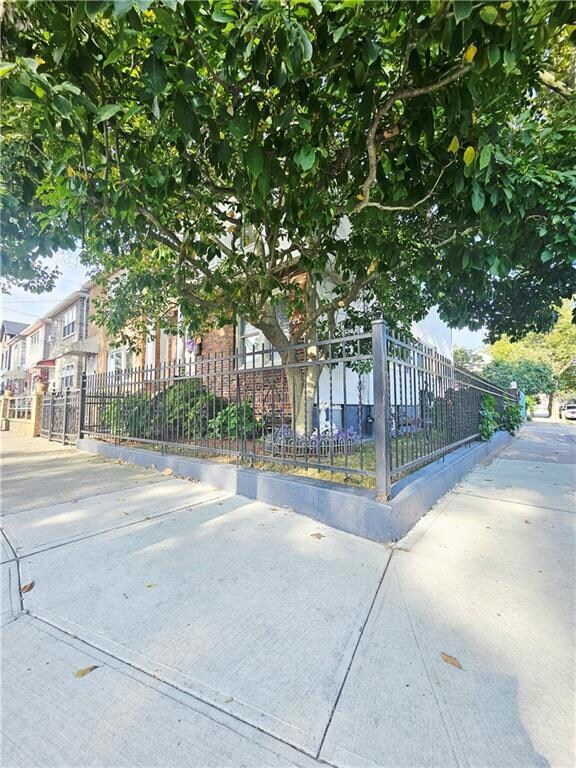
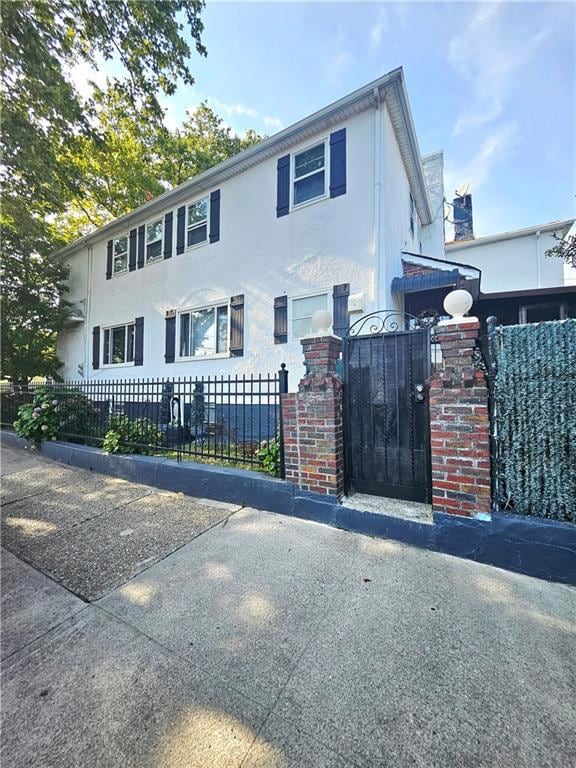
2177 W 7th St Brooklyn, NY 11223
Gravesend NeighborhoodEstimated payment $11,172/month
Highlights
- Wood Flooring
- 3-minute walk to Gravesend-86 Street
- Multiple cooling system units
- P.S. 95 - The Gravesend Rated A-
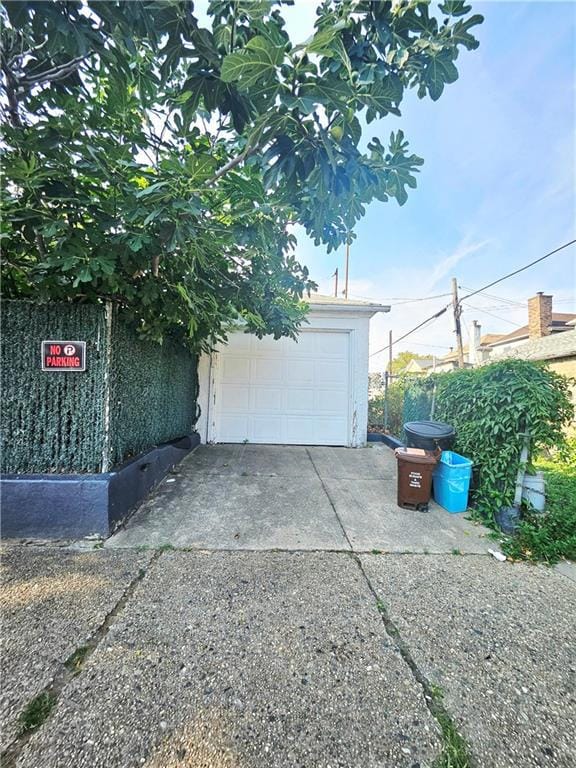
- 2 Car Detached Garage
- Heating System Uses Steam
About This Home
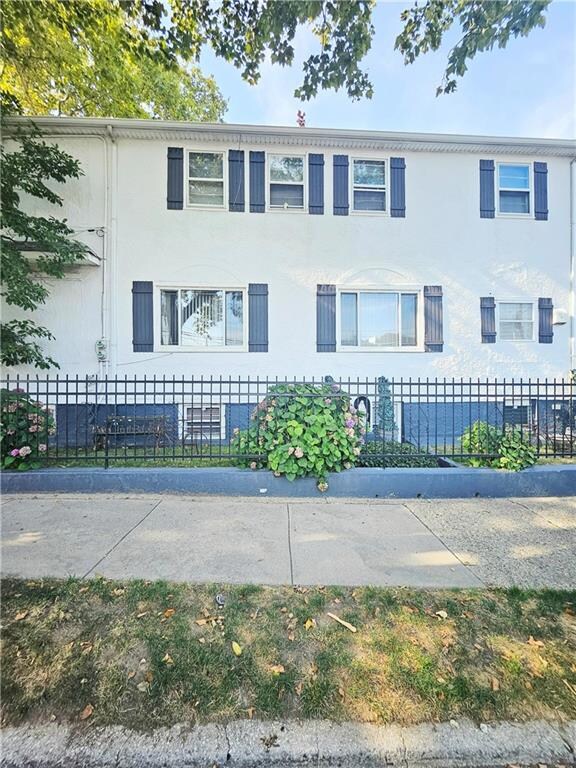
Welcome to this rarely available fully detached corner property—a true gem offering maximum privacy, private driveway, detached garage, and a beautiful backyard oasis, perfect for family gatherings and year-round enjoyment. Located in a prime residential neighborhood, this R5 zoning two-family home is just minutes away from Avenue U, 86th Street shopping district, and local restaurants, supermarkets, and essential amenities. Enjoy the convenience of walkability while living in a serene, private setting. The first floor features a spacious Two- bedrooms unit with a bright living room, functional kitchen, and a charming sunroom overlooking the lush backyard—ideal for relaxing through all four seasons. The second floor is another comfortable Two-bedrooms apartment, complete with its own storage area, providing flexible living or rental opportunities. The finished basement includes a private entrance, a family room, a full bathroom, and a dedicated office space. Enjoy a clean, fenced backyard ideal for BBQs, family parties, This home checks all the boxes for location, space, and lifestyle. Don’t miss this opportunity to own a fully detached, corner two-family home in a highly desirable area—perfect for end-users or investors alike!
Listing Agent
RE/MAX Real Estate Professionals License #10401237592 Listed on: 08/18/2025

Property Details
Home Type
- Multi-Family
Est. Annual Taxes
- $7,944
Year Built
- Built in 1920
Lot Details
- 2,100 Sq Ft Lot
- Lot Dimensions are 100 x 21
- Back and Front Yard
Parking
- 2 Car Detached Garage
Home Design
- Wood Frame Construction
- Pitched Roof
- Siding
Interior Spaces
- 2,430 Sq Ft Home
- 2-Story Property
- Finished Basement
- Basement Fills Entire Space Under The House
- Stove
Flooring
- Wood
- Tile
Bedrooms and Bathrooms
- 4 Bedrooms
- 3 Full Bathrooms
Utilities
- Multiple cooling system units
- Heating System Uses Steam
- Heating System Uses Gas
- 200+ Amp Service
- Gas Water Heater
Community Details
- 2 Units
Listing and Financial Details
- Tax Block 7120
Map
Home Values in the Area
Average Home Value in this Area
Tax History
| Year | Tax Paid | Tax Assessment Tax Assessment Total Assessment is a certain percentage of the fair market value that is determined by local assessors to be the total taxable value of land and additions on the property. | Land | Improvement |
|---|---|---|---|---|
| 2025 | $7,181 | $49,140 | $13,080 | $36,060 |
| 2024 | $7,181 | $54,000 | $13,080 | $40,920 |
| 2023 | $6,937 | $65,880 | $13,080 | $52,800 |
| 2022 | $4,849 | $58,860 | $13,080 | $45,780 |
| 2021 | $6,481 | $64,560 | $13,080 | $51,480 |
| 2020 | $3,222 | $62,100 | $13,080 | $49,020 |
| 2019 | $6,236 | $54,840 | $13,080 | $41,760 |
| 2018 | $5,695 | $31,170 | $8,667 | $22,503 |
| 2017 | $5,416 | $29,738 | $6,670 | $23,068 |
| 2016 | $2,208 | $28,305 | $8,372 | $19,933 |
| 2015 | $1,253 | $28,290 | $9,134 | $19,156 |
| 2014 | $1,253 | $27,469 | $8,797 | $18,672 |
Property History
| Date | Event | Price | List to Sale | Price per Sq Ft |
|---|---|---|---|---|
| 08/18/2025 08/18/25 | For Sale | $1,990,000 | -- | $819 / Sq Ft |
Purchase History
| Date | Type | Sale Price | Title Company |
|---|---|---|---|
| Deed | -- | -- | |
| Deed | -- | -- | |
| Interfamily Deed Transfer | -- | -- | |
| Interfamily Deed Transfer | -- | -- | |
| Deed | $79,000 | First American Title Ins Co | |
| Deed | $79,000 | First American Title Ins Co |
Source: Brooklyn Board of REALTORS®
MLS Number: 495087
APN: 07120-0044
Disclaimer: Certain information contained herein is derived from information provided by parties other than Homes.com. All information provided is deemed reliable, but is not guaranteed to be accurate and should be independently verified.
![]() The property information being provided is for consumers’ personal, non-commercial use and may not be used for any purpose other than to identify prospective properties consumers may be interested in purchasing. Listing information is deemed reliable, but not guaranteed. The data relating to real estate for sale on this web site comes in part from the participating Brokers.
The property information being provided is for consumers’ personal, non-commercial use and may not be used for any purpose other than to identify prospective properties consumers may be interested in purchasing. Listing information is deemed reliable, but not guaranteed. The data relating to real estate for sale on this web site comes in part from the participating Brokers.
- 2797 86th St Unit 2B
- 321 Avenue X
- 86 Avenue S
- 86 Avenue S Unit 3
- 147 Bay 40th St Unit 2
- 398 Kings Hwy Unit 408
- 176 28th Ave
- 226 Avenue Z
- 1684 W 9th St Unit 2nd Floor
- 2312 Coney Island Ave
- 1600 W 5th St
- 2711 Coney Island Ave Unit 3Fl
- 1610 Dahill Rd
- 2971 Shell Rd
- 1601 Dahill Rd
- 7819 Bay Pkwy
- 2286 Cropsey Ave Unit ID1056671P
- 207 Bay 31st St Unit ID1056666P
- 2458 E 12th St Unit 2
- 2266 Cropsey Ave Unit ID1056673P