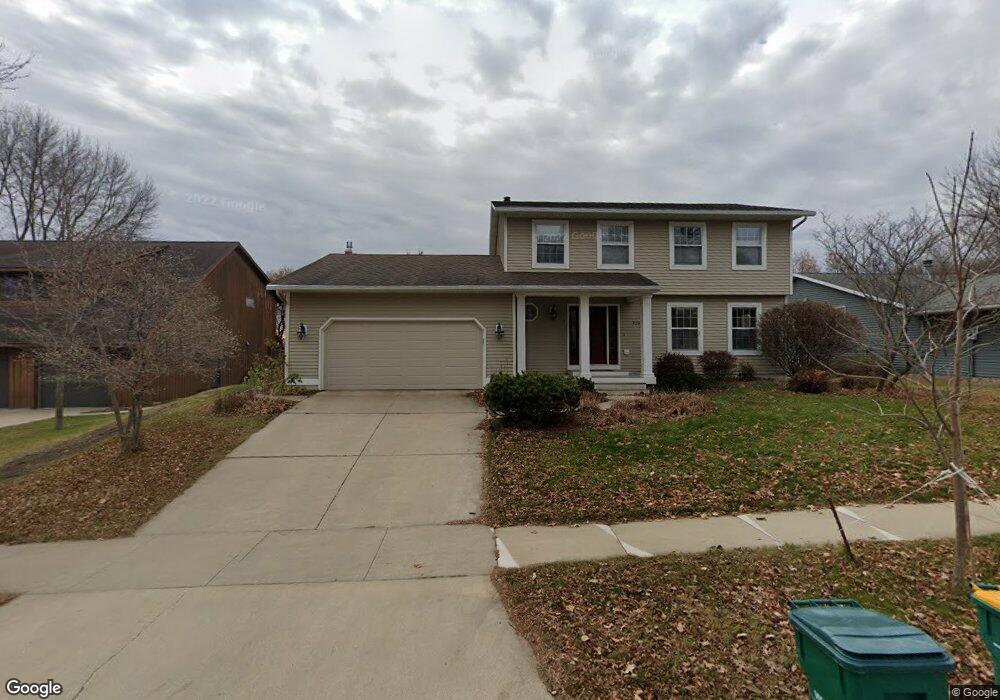
2178 17th St NE Rochester, MN 55906
Estimated Value: $482,756 - $558,000
4
Beds
4
Baths
3,614
Sq Ft
$144/Sq Ft
Est. Value
About This Home
This home is located at 2178 17th St NE, Rochester, MN 55906 and is currently estimated at $519,439, approximately $143 per square foot. 2178 17th St NE is a home located in Olmsted County with nearby schools including Jefferson Elementary School, Kellogg Middle School, and Century Senior High School.
Ownership History
Date
Name
Owned For
Owner Type
Purchase Details
Closed on
Aug 27, 2020
Sold by
Sylwestrak Stephen and Langton Yanowitz Sonja
Bought by
Sylwestrak Stephen and Langton Yanowitz Sonja
Current Estimated Value
Purchase Details
Closed on
Nov 29, 2018
Sold by
Yanowitz Alan J and Langton Diane L
Bought by
Langton Yanowitz Sonja Mae and Sylwestrak Stephen
Home Financials for this Owner
Home Financials are based on the most recent Mortgage that was taken out on this home.
Original Mortgage
$292,500
Outstanding Balance
$257,699
Interest Rate
4.8%
Mortgage Type
New Conventional
Estimated Equity
$261,740
Purchase Details
Closed on
Jul 13, 2018
Sold by
Petz Bruce R and Petz Janice L
Bought by
Yanowitz Alan J and Langton Diane L
Purchase Details
Closed on
Feb 14, 2013
Sold by
Petz Bruce R and Petz Janice L
Bought by
Petz Bruce R and Petz Janice L
Create a Home Valuation Report for This Property
The Home Valuation Report is an in-depth analysis detailing your home's value as well as a comparison with similar homes in the area
Home Values in the Area
Average Home Value in this Area
Purchase History
| Date | Buyer | Sale Price | Title Company |
|---|---|---|---|
| Sylwestrak Stephen | -- | None Available | |
| Langton Yanowitz Sonja Mae | $390,000 | Title Services Inc | |
| Yanowitz Alan J | $390,000 | None Available | |
| Petz Bruce R | -- | None Available |
Source: Public Records
Mortgage History
| Date | Status | Borrower | Loan Amount |
|---|---|---|---|
| Open | Langton Yanowitz Sonja Mae | $292,500 |
Source: Public Records
Tax History Compared to Growth
Tax History
| Year | Tax Paid | Tax Assessment Tax Assessment Total Assessment is a certain percentage of the fair market value that is determined by local assessors to be the total taxable value of land and additions on the property. | Land | Improvement |
|---|---|---|---|---|
| 2024 | $5,670 | $413,100 | $70,000 | $343,100 |
| 2023 | $5,132 | $407,900 | $70,000 | $337,900 |
| 2022 | $5,298 | $424,900 | $60,000 | $364,900 |
| 2021 | $4,844 | $387,200 | $60,000 | $327,200 |
| 2020 | $4,738 | $356,100 | $50,000 | $306,100 |
| 2019 | $4,452 | $335,900 | $50,000 | $285,900 |
| 2018 | $2,019 | $318,800 | $50,000 | $268,800 |
| 2017 | $3,968 | $290,200 | $50,000 | $240,200 |
| 2016 | $3,792 | $270,100 | $42,500 | $227,600 |
| 2015 | $1,799 | $252,200 | $42,200 | $210,000 |
| 2014 | $1,748 | $254,900 | $42,200 | $212,700 |
| 2012 | -- | $249,200 | $42,102 | $207,098 |
Source: Public Records
Map
Nearby Homes
- 1703 20th Ave NE
- 1616 Century Ridge Ln NE
- 2651 Century Pine Ln NE
- 1251 19th Ave NE
- 1227 19th Ave NE
- 1500 Viola Rd NE
- 1117 Century Village Ln NE
- 1129 Century Village Ln NE
- 1121 Century Village Ln NE
- 1125 Century Village Ln NE
- 1093 Century Village Ln NE
- 1085 Century Village Ln NE
- 1097 Century Village Ln NE
- 1105 Century Village Ln NE
- 1113 Century Village Ln NE
- 1109 Century Village Ln NE
- 1089 Century Village Ln NE
- 2129 E Heights Ln NE
- 2283 Centurion Ct NE
- 1073 Century Village Ln NE
- 2172 17th St NE
- 2184 17th St NE
- 2166 17th St NE
- 2190 17th St NE
- 2160 2160 17th-Street-ne
- 2160 17th St NE
- 2167 17th St NE
- 2173 17th St NE
- 1702 22nd Ave NE
- 2161 17th St NE
- 1710 22nd Ave NE
- 2156 17th St NE
- 2157 17th St NE
- 1718 22nd Ave NE
- 1725 22nd Ave NE
- 2151 2151 17th-Street-ne
- 2151 17th St NE
- 2150 17th St NE
- 2166 Parkwood Hills Dr NE
- 2160 Parkwood Hills Dr NE