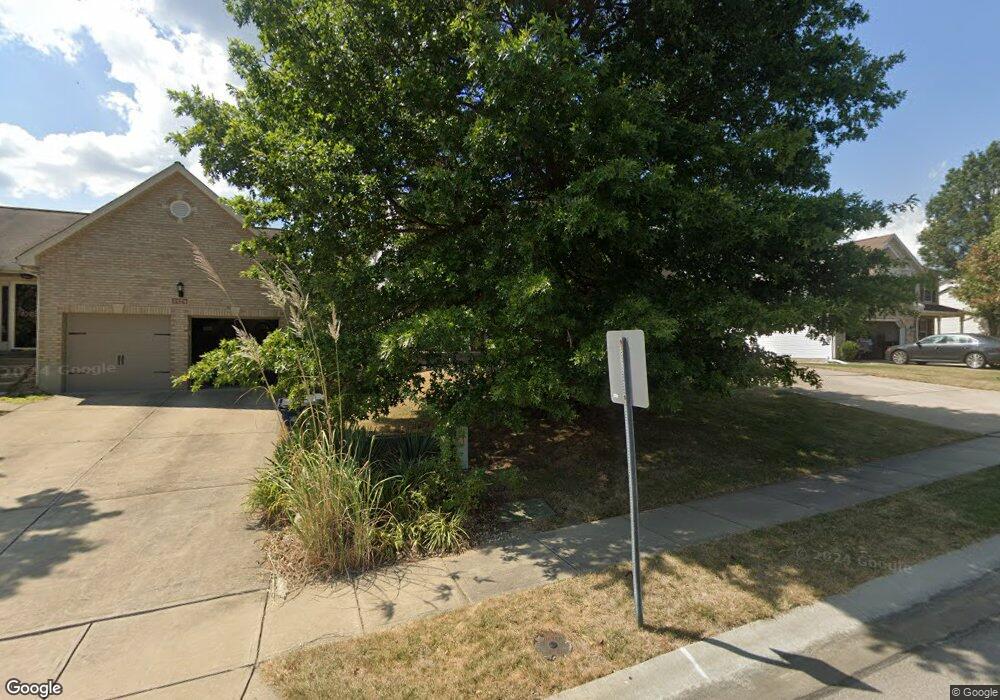
2178 Canyon Ct Hebron, KY 41048
Estimated Value: $345,000 - $382,000
3
Beds
4
Baths
1,996
Sq Ft
$179/Sq Ft
Est. Value
About This Home
This home is located at 2178 Canyon Ct, Hebron, KY 41048 and is currently estimated at $358,061, approximately $179 per square foot. 2178 Canyon Ct is a home located in Boone County with nearby schools including North Pointe Elementary School, Conner Middle School, and Conner High School.
Ownership History
Date
Name
Owned For
Owner Type
Purchase Details
Closed on
Sep 11, 2013
Sold by
Wood Aaron and Luxsitanonda Yaovapa
Bought by
White Barry and White Donna
Current Estimated Value
Purchase Details
Closed on
Jul 14, 2000
Sold by
Noll Builders Llc
Bought by
Barry Thomas E and Barry Tamara L
Home Financials for this Owner
Home Financials are based on the most recent Mortgage that was taken out on this home.
Original Mortgage
$157,000
Interest Rate
7.5%
Mortgage Type
New Conventional
Purchase Details
Closed on
Dec 16, 1999
Sold by
Blazem Group Llc
Bought by
Noll Builders Llc
Home Financials for this Owner
Home Financials are based on the most recent Mortgage that was taken out on this home.
Original Mortgage
$324,000
Interest Rate
7.85%
Mortgage Type
New Conventional
Purchase Details
Closed on
May 28, 1999
Sold by
White Barry L
Bought by
Barry L White Revocable Trust
Create a Home Valuation Report for This Property
The Home Valuation Report is an in-depth analysis detailing your home's value as well as a comparison with similar homes in the area
Home Values in the Area
Average Home Value in this Area
Purchase History
| Date | Buyer | Sale Price | Title Company |
|---|---|---|---|
| White Barry | $193,000 | 360 American Title Svcs Llc | |
| Barry Thomas E | $176,670 | -- | |
| Noll Builders Llc | $111,600 | -- | |
| Barry L White Revocable Trust | -- | -- |
Source: Public Records
Mortgage History
| Date | Status | Borrower | Loan Amount |
|---|---|---|---|
| Previous Owner | Barry Thomas E | $157,000 | |
| Previous Owner | Noll Builders Llc | $324,000 |
Source: Public Records
Tax History
| Year | Tax Paid | Tax Assessment Tax Assessment Total Assessment is a certain percentage of the fair market value that is determined by local assessors to be the total taxable value of land and additions on the property. | Land | Improvement |
|---|---|---|---|---|
| 2025 | $2,082 | $238,900 | $35,000 | $203,900 |
| 2024 | $2,075 | $238,900 | $35,000 | $203,900 |
| 2023 | $1,656 | $201,400 | $30,000 | $171,400 |
| 2022 | $1,726 | $201,400 | $30,000 | $171,400 |
| 2021 | $1,798 | $201,400 | $30,000 | $171,400 |
| 2020 | $1,677 | $193,000 | $30,000 | $163,000 |
| 2019 | $1,690 | $193,000 | $30,000 | $163,000 |
| 2018 | $1,756 | $193,000 | $30,000 | $163,000 |
| 2017 | $1,694 | $193,000 | $30,000 | $163,000 |
| 2015 | $1,689 | $193,000 | $30,000 | $163,000 |
| 2013 | -- | $208,000 | $30,000 | $178,000 |
Source: Public Records
Map
Nearby Homes
- 909 Surfridge Dr
- 1748 Ledgestone Way
- 1745 Ledgestone Way
- Oak Hill Plan at Rivers Pointe Estates - Rivers Pointe Estates - 100'
- BEACHWOOD Plan at Rivers Pointe Estates - Rivers Pointes Villas
- Brennan Plan at Rivers Pointe Estates - Rivers Pointe Estates - 100'
- Crestwood Plan at Rivers Pointe Estates - Rivers Pointe Estates - 100'
- Sebastian Plan at Rivers Pointe Estates - Rivers Pointe Estates - 100'
- SARASOTA Plan at Rivers Pointe Estates - Rivers Pointes Villas
- Champlain Plan at Rivers Pointe Estates - Rivers Pointe Estates - 100'
- NAPLES Plan at Rivers Pointe Estates - Rivers Pointes Villas
- HIALEAH Plan at Rivers Pointe Estates - Rivers Pointes Villas
- Bedford Plan at Rivers Pointe Estates - Rivers Pointe Estates - 100'
- 2236 Silver Peak Dr
- 1 Rivers Pointe Dr
- 2305 Bentwood Ct
- 2309 Bentwood Ct
- 1718 Ledgestone Way
- 2432 Rivers Pointe Dr
- Aldridge Plan at Rivers Pointe Estates
- 2182 Canyon Ct
- 2174 Canyon Ct
- 1038 Meadowbrook Ct
- 2186 Canyon Ct
- 1034 Meadowbrook Ct
- 1042 Meadowbrook Ct
- 2177 Canyon Ct
- 1030 Meadowbrook Ct
- 2181 Canyon Ct
- 2171 Canyon Ct
- 2185 Canyon Ct
- 2169 Canyon Ct
- 2192 Northbrook Ln
- 1050 Meadowbrook Ct
- 44 Meadowbrook Ct
- 30 Meadowbrook Ct
- 2196 Northbrook Ln
- 2191 Canyon Ct
- 2165 Canyon Ct
- 2192 Glenview Dr