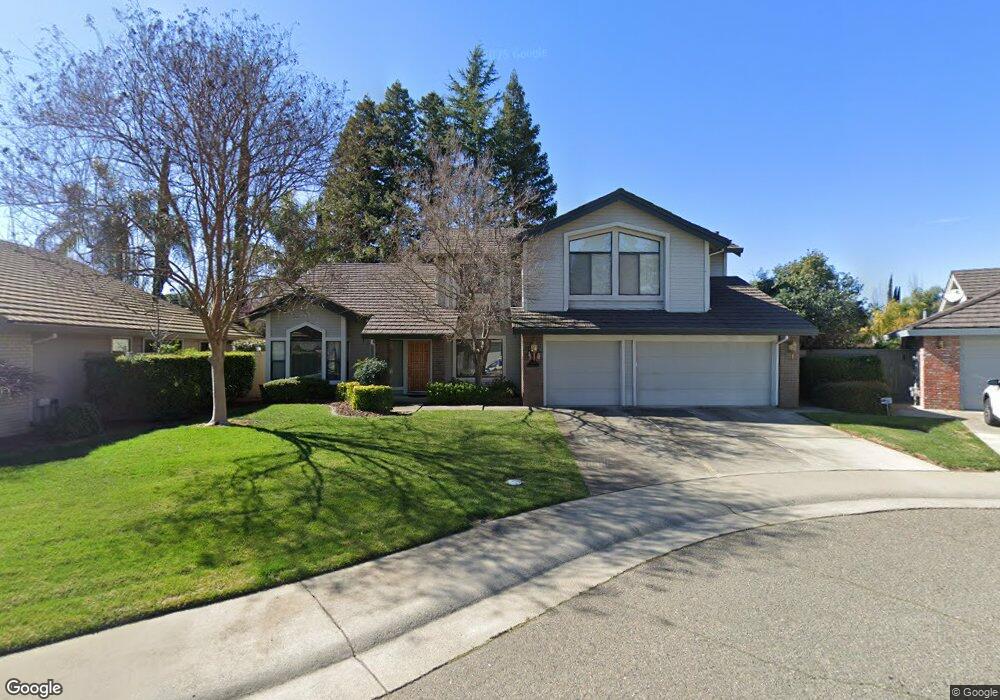
2178 Pilot Creek Ct Gold River, CA 95670
Estimated Value: $762,000 - $851,000
3
Beds
3
Baths
2,945
Sq Ft
$273/Sq Ft
Est. Value
About This Home
This home is located at 2178 Pilot Creek Ct, Gold River, CA 95670 and is currently estimated at $803,710, approximately $272 per square foot. 2178 Pilot Creek Ct is a home located in Sacramento County with nearby schools including Gold River Discovery Center, Rio Americano High School, and Summit Christian School.
Ownership History
Date
Name
Owned For
Owner Type
Purchase Details
Closed on
Jul 5, 2007
Sold by
Peterson Steve H
Bought by
Peterson Steve H and Steve H Peterson Living Trust
Current Estimated Value
Purchase Details
Closed on
Apr 17, 1997
Sold by
Pascua Duane E and Pascua Peggy
Bought by
Peterson Steve H
Home Financials for this Owner
Home Financials are based on the most recent Mortgage that was taken out on this home.
Original Mortgage
$214,600
Outstanding Balance
$20,892
Interest Rate
4.95%
Estimated Equity
$782,818
Purchase Details
Closed on
Jul 20, 1995
Sold by
Northfork Communities
Bought by
Pascua Duane E and Pascua Peggy
Home Financials for this Owner
Home Financials are based on the most recent Mortgage that was taken out on this home.
Original Mortgage
$260,300
Interest Rate
7.62%
Create a Home Valuation Report for This Property
The Home Valuation Report is an in-depth analysis detailing your home's value as well as a comparison with similar homes in the area
Home Values in the Area
Average Home Value in this Area
Purchase History
| Date | Buyer | Sale Price | Title Company |
|---|---|---|---|
| Peterson Steve H | -- | None Available | |
| Peterson Steve H | $282,000 | Stewart Title | |
| Pascua Duane E | $274,000 | Placer Title Company |
Source: Public Records
Mortgage History
| Date | Status | Borrower | Loan Amount |
|---|---|---|---|
| Open | Peterson Steve H | $214,600 | |
| Previous Owner | Pascua Duane E | $260,300 |
Source: Public Records
Tax History
| Year | Tax Paid | Tax Assessment Tax Assessment Total Assessment is a certain percentage of the fair market value that is determined by local assessors to be the total taxable value of land and additions on the property. | Land | Improvement |
|---|---|---|---|---|
| 2025 | $5,445 | $459,267 | $97,706 | $361,561 |
| 2024 | $5,445 | $450,263 | $95,791 | $354,472 |
| 2023 | $5,305 | $441,435 | $93,913 | $347,522 |
| 2022 | $5,272 | $432,780 | $92,072 | $340,708 |
| 2021 | $5,182 | $424,295 | $90,267 | $334,028 |
| 2020 | $5,084 | $419,945 | $89,342 | $330,603 |
| 2019 | $4,979 | $411,712 | $87,591 | $324,121 |
| 2018 | $4,918 | $403,640 | $85,874 | $317,766 |
| 2017 | $4,867 | $395,727 | $84,191 | $311,536 |
| 2016 | $4,500 | $387,969 | $82,541 | $305,428 |
| 2015 | $4,422 | $382,143 | $81,302 | $300,841 |
| 2014 | $4,328 | $374,658 | $79,710 | $294,948 |
Source: Public Records
Map
Nearby Homes
- 11864 S Carson Way
- 11871 Silver Cliff Way
- 11909 Rising Sun Way
- 11775 Beaver Bar Ct
- 11770 Beaver Bar Ct
- 11950 Rising Sun Way
- 2127 Gold Haven Ct
- 11939 Old Eureka Way
- 2046 Texas Bar Ct
- 2050 Campton Cir
- 12032 Gold Pointe Ln
- 11637 Red Gulch Ct
- 12129 Gold Bluff Ln
- 8764 Bluff Ln
- 1957 Empire Oaks Ct
- 8899 Bluff Ln
- 2024 Empire Mine Cir
- 11476 Hesperian Cir
- 11474 Round House Ct
- 12001 Prospect Hill Dr
- 2182 Pilot Creek Ct
- 2170 Pilot Creek Ct
- 2169 Nugget Creek Ct
- 11859 S Carson Way
- 2186 Pilot Creek Ct
- 2165 Nugget Creek Ct
- 2171 Pilot Creek Ct
- 2179 Pilot Creek Ct
- 2171 Nugget Creek Ct
- 11660 N Carson Way
- 11855 S Carson Way
- 2185 Pilot Creek Ct
- 2175 Pilot Creek Ct
- 11664 N Carson Way
- 11656 N Carson Way
- 11668 N Carson Way
- 11881 S Carson Way
- 11851 S Carson Way
- 2170 Nugget Creek Ct
- 11674 N Carson Way
Your Personal Tour Guide
Ask me questions while you tour the home.