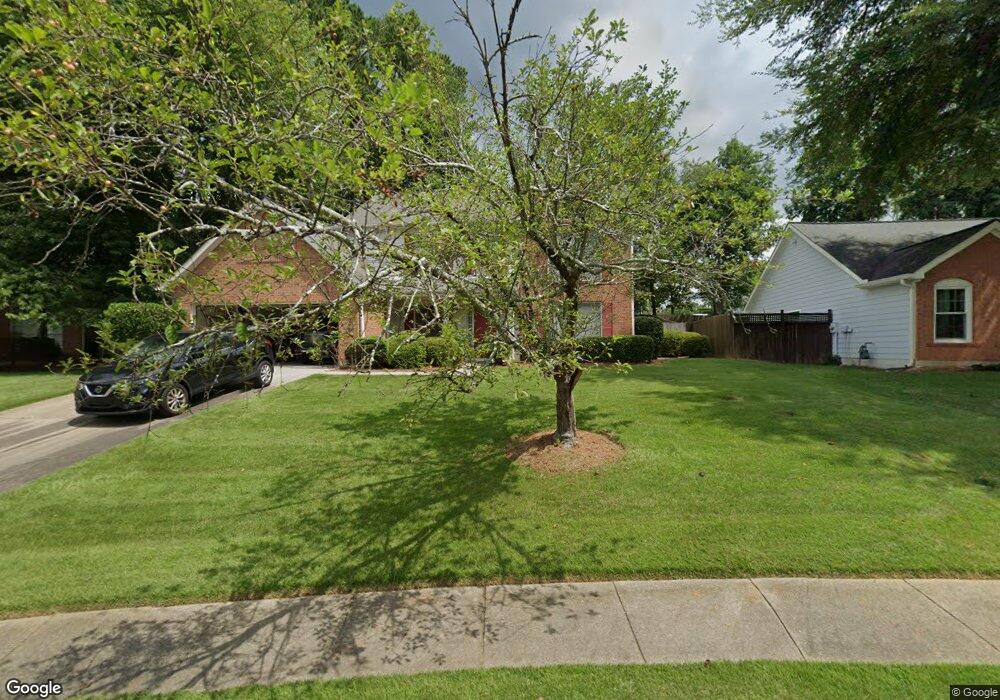
2178 Whitehall Dr NE Marietta, GA 30066
Sandy Plains NeighborhoodEstimated Value: $456,192 - $525,000
4
Beds
3
Baths
2,236
Sq Ft
$218/Sq Ft
Est. Value
About This Home
This home is located at 2178 Whitehall Dr NE, Marietta, GA 30066 and is currently estimated at $488,298, approximately $218 per square foot. 2178 Whitehall Dr NE is a home located in Cobb County with nearby schools including Kincaid Elementary School, Daniell Middle School, and Sprayberry High School.
Ownership History
Date
Name
Owned For
Owner Type
Purchase Details
Closed on
Oct 28, 2010
Sold by
Rowell James R
Bought by
Rowell James R and Rowell Amanda
Current Estimated Value
Home Financials for this Owner
Home Financials are based on the most recent Mortgage that was taken out on this home.
Original Mortgage
$178,119
Outstanding Balance
$118,434
Interest Rate
4.5%
Mortgage Type
FHA
Estimated Equity
$369,864
Purchase Details
Closed on
Dec 20, 2000
Sold by
Severini Steven C
Bought by
Rowell James R
Home Financials for this Owner
Home Financials are based on the most recent Mortgage that was taken out on this home.
Original Mortgage
$176,500
Interest Rate
7.65%
Mortgage Type
New Conventional
Purchase Details
Closed on
Jun 24, 1993
Sold by
Mason Albert G
Bought by
Severini Steven C
Home Financials for this Owner
Home Financials are based on the most recent Mortgage that was taken out on this home.
Original Mortgage
$109,600
Interest Rate
7.52%
Create a Home Valuation Report for This Property
The Home Valuation Report is an in-depth analysis detailing your home's value as well as a comparison with similar homes in the area
Home Values in the Area
Average Home Value in this Area
Purchase History
| Date | Buyer | Sale Price | Title Company |
|---|---|---|---|
| Rowell James R | $8,000 | -- | |
| Rowell James R | $176,500 | -- | |
| Severini Steven C | $137,000 | -- |
Source: Public Records
Mortgage History
| Date | Status | Borrower | Loan Amount |
|---|---|---|---|
| Open | Rowell James R | $178,119 | |
| Previous Owner | Rowell James R | $176,500 | |
| Previous Owner | Severini Steven C | $109,600 |
Source: Public Records
Tax History Compared to Growth
Tax History
| Year | Tax Paid | Tax Assessment Tax Assessment Total Assessment is a certain percentage of the fair market value that is determined by local assessors to be the total taxable value of land and additions on the property. | Land | Improvement |
|---|---|---|---|---|
| 2025 | $5,206 | $172,800 | $40,000 | $132,800 |
| 2024 | $5,372 | $178,172 | $40,000 | $138,172 |
| 2023 | $4,937 | $163,756 | $34,000 | $129,756 |
| 2022 | $3,855 | $127,008 | $20,000 | $107,008 |
| 2021 | $3,494 | $115,120 | $20,000 | $95,120 |
| 2020 | $3,152 | $103,864 | $20,000 | $83,864 |
| 2019 | $3,152 | $103,864 | $20,000 | $83,864 |
| 2018 | $2,991 | $98,564 | $16,800 | $81,764 |
| 2017 | $2,469 | $85,880 | $15,200 | $70,680 |
| 2016 | $2,469 | $85,880 | $15,200 | $70,680 |
| 2015 | $1,999 | $67,852 | $16,000 | $51,852 |
| 2014 | $2,016 | $67,852 | $0 | $0 |
Source: Public Records
Map
Nearby Homes
- 2116 Morgan Rd NE
- 2314 Sandy Oaks Dr
- 1505 Kincaid Rd
- 1780 Kinridge Rd
- 1972 Granite Mill Rd
- Robie Plan at The Village at Sandy Plains
- Harbor Plan at The Village at Sandy Plains
- Hanover Plan at The Village at Sandy Plains
- Bowen Plan at The Village at Sandy Plains
- Elston Plan at The Village at Sandy Plains
- BALDWIN Plan at The Village at Sandy Plains
- 1850 Butterfly Way NE
- 1854 Butterfly Way
- 2020 Starlight Dr
- 2252 Carefree Cir Unit 3
- 1838 Butterfly NE
- 1834 Butterfly Way
- 1834 Butterfly NE
- 1490 Longwing Ln
- 1822 Hasty Rd
- 2176 Whitehall Dr NE
- 2180 Whitehall Dr NE
- 2174 Whitehall Dr NE
- 1674 Whitlock Rd
- 2182 Whitehall Dr NE
- 1666 Whitlock Rd
- 2175 Whitehall Dr NE
- 2181 Whitehall Dr NE
- 1682 Whitlock Rd
- 2184 Whitehall Dr NE
- 2172 Whitehall Dr NE
- 1658 Whitlock Rd
- 2173 Whitehall Dr NE
- 2185 Whitehall Dr NE
- 2186 Whitehall Dr NE
- 1690 Whitlock Rd
- 2171 Whitehall Dr NE
- 2170 Whitehall Dr NE
- 1792 Whitehall Ct NE
- 1656 Whitlock Rd