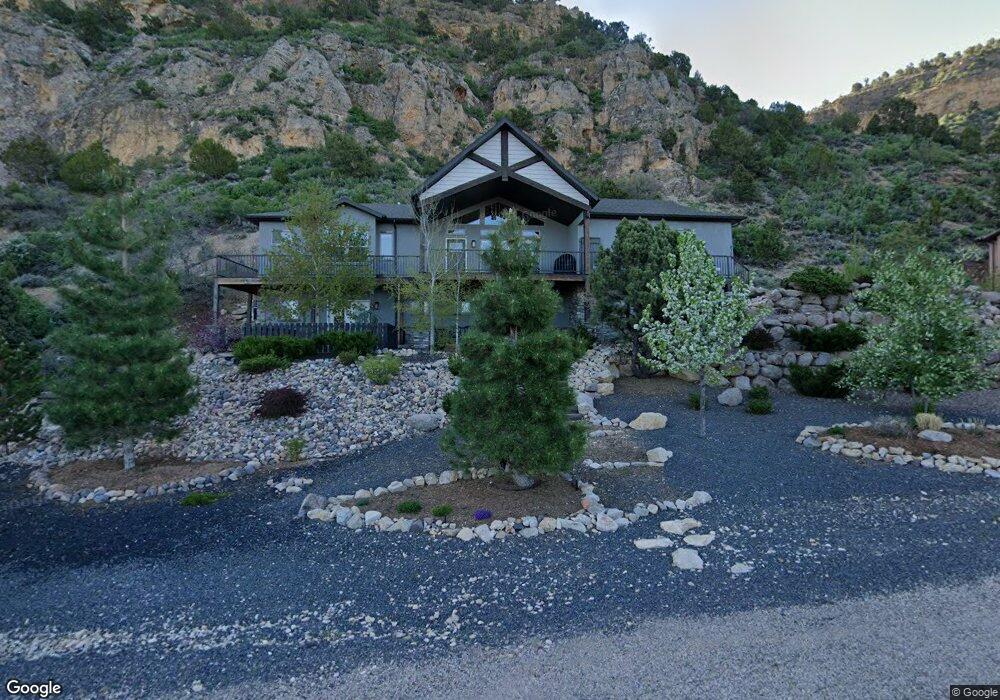
2179 S Chekshani Cliff New Harmony, UT 84757
Estimated Value: $615,000 - $1,292,000
3
Beds
3
Baths
2,910
Sq Ft
$297/Sq Ft
Est. Value
About This Home
This home is located at 2179 S Chekshani Cliff, New Harmony, UT 84757 and is currently estimated at $864,590, approximately $297 per square foot. 2179 S Chekshani Cliff is a home located in Iron County with nearby schools including Cedar East School, Cedar Middle School, and Cedar City High School.
Ownership History
Date
Name
Owned For
Owner Type
Purchase Details
Closed on
Nov 14, 2023
Sold by
Nowell Family Trust
Bought by
Wanser Keith H and Wanser Cj
Current Estimated Value
Home Financials for this Owner
Home Financials are based on the most recent Mortgage that was taken out on this home.
Original Mortgage
$466,860
Outstanding Balance
$458,700
Interest Rate
7.49%
Mortgage Type
New Conventional
Estimated Equity
$405,890
Purchase Details
Closed on
Jan 4, 2022
Sold by
Wedeking Family Trust
Bought by
Nowell Family Trust
Purchase Details
Closed on
Dec 28, 2020
Sold by
Baker David and Baker Paulette E
Bought by
Wedeking Aaron A and Wedeking Velinda C
Purchase Details
Closed on
May 5, 2008
Sold by
Baker David and Baker Paulette E
Bought by
Baker David and Baker Paulette E
Purchase Details
Closed on
Sep 26, 2005
Sold by
Allen Michael and Allen Paulette L
Bought by
Baker David and Baker Paulette E
Create a Home Valuation Report for This Property
The Home Valuation Report is an in-depth analysis detailing your home's value as well as a comparison with similar homes in the area
Purchase History
| Date | Buyer | Sale Price | Title Company |
|---|---|---|---|
| Wanser Keith H | -- | Terra Title | |
| Nowell Family Trust | -- | Vanguard Title | |
| Wedeking Aaron A | -- | Southern Ut Ttl Co Of Cedar | |
| Baker David | -- | Accommodation | |
| Baker David | -- | -- | |
| Baker David | -- | -- |
Source: Public Records
Mortgage History
| Date | Status | Borrower | Loan Amount |
|---|---|---|---|
| Open | Wanser Keith H | $466,860 |
Source: Public Records
Tax History
| Year | Tax Paid | Tax Assessment Tax Assessment Total Assessment is a certain percentage of the fair market value that is determined by local assessors to be the total taxable value of land and additions on the property. | Land | Improvement |
|---|---|---|---|---|
| 2025 | $3,212 | $412,056 | $107,062 | $304,994 |
| 2023 | $3,004 | $432,900 | $101,960 | $330,940 |
| 2022 | $3,312 | $370,265 | $84,970 | $285,295 |
| 2021 | $2,247 | $251,180 | $45,050 | $206,130 |
| 2020 | $2,214 | $219,120 | $37,625 | $181,495 |
| 2019 | $2,059 | $195,460 | $37,625 | $157,835 |
| 2018 | $2,029 | $188,130 | $37,625 | $150,505 |
| 2017 | $688 | $63,950 | $63,950 | $0 |
| 2016 | $581 | $48,750 | $48,750 | $0 |
| 2015 | $610 | $48,750 | $0 | $0 |
| 2014 | $646 | $48,750 | $0 | $0 |
Source: Public Records
Map
Nearby Homes
- 2235 Chekshani Cliffs Ln Unit Lot 59
- 2235 Chekshani Cliffs Ln
- 921 W Chuwi Path
- 921 Path
- 0 1 Ac Ft of Water Rights Unit 26-271242
- 0 1 Ac Ft of Water Rights Unit 115695
- 0 1 Ac Ft of Water Rights Unit 2808889
- 0 Oak Valley Estates Lot 9 Unit 109813
- 253.26 Acres South West of Kanarra
- 0 S Allred Rd
- 1380 W Hayward Mountain Rd
- 0.05 acre Priority Date 1961
- 65 W 200 South St
- 70 Acre Feet of Water
- 1 Acre Foot of Water
- 70 Acre Feet of Water
- 40 Acres
- 401 S 3430 E
- 310 Acres
- 253.26 Acres Southwest of Kanarra
- 2179 Chekshani Cliffs
- 2179 Chekshani Dr
- 2179 Chekshani Cliffs Ln
- 2145 Chekshani Clfs Ln
- 2145 S Chekshani Cliffs
- 2198 S Chekshani Cliffs Dr
- 2229 Chekshani Cliffs Ln
- 2117 Chekshani Cliffs
- 2112 S Chekshani Cliffs
- 2112 S Chekshani Cliff
- 2143 Tu-Ee Trail
- 2143 Tu-Ee Trail Unit 36
- 2230 S Chekshani Cliffs Ln
- 2167 S Tu-Ee Trail
- 2167 S Tu Ee Trail
- 2167 Tu-Ee Trail
- 2081 S Tu Ee Trail
- 2084 S Chekshani Cliff
- 2230 S Chekshani Cliff
- 2081 Tu-Ee Trail
Your Personal Tour Guide
Ask me questions while you tour the home.